Hey, I’m a new relay operator, and I’ve been obsessively monitoring my relay stats for the last week as I gain consensus weight.
Earlier today, I noticed a spike in memory usage (700ish MiB to 3.4 GiB), and spike in cpu usage (0.25 to 1.0). At that same time, metrics.torproject.org began to report my node as overloaded.
This was confusing to me, as I was still substantially below resource limits:
3.4 GiB memory used of 6.0 GiB “detected limit” of 16.0 GiB available memory
1.0 cpu avg usage on a 4-core system
~6000 open sockets, out of 20000 available ports
6 MiB/s avg network util up/down out of 40MiB/s configured limit on a 100 MiB/s link
The CPU usage stayed elevated for a 5ish minutes once I noticed it, before falling back to normal levels. Memory usage jumped up to the new levels immediately, and has remained at a higher level even after CPU usage fell. The overloaded warning dissappeared from metrics.torproject.org as soon as the cpu load fell (This is extra confused because the docs suggest that this label persists for a few days). Throughout this, there was no sudden jump in network util (as judged by watching nyx), and there were no log statements to indicate any issues, tor logs or otherwise.
Most likely, one of the waves of DDoS attack which is happening for many months now.
I saw DDoS activity correlation with gaining and losing flags, so these events may be in fact related.
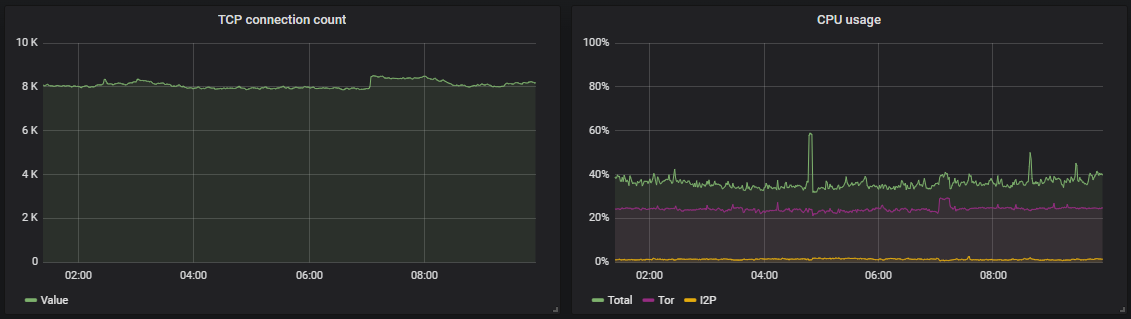
You may want to watch for amount of TCP connections.
During this attack I noticed increased amounts of connections made by attacker.
I even banned some of addresses, but bans should be done carefully, for example Snowflake bridges can produce large amounts of connections too - they should not be banned of course.
It is possible to install monitoring system and tune it to show parameters like CPU usage changing over the time.
This is how suspicious activity looks for me with custom made monitoring system, based on Grafana: