I expect this topic to be ignored like previous one, but I need to say about it anyway.
Snowflake proxy have the same problem as Tor - uncontrollable memory usage growth.
Several hours ago it tried to use ~8GB of RAM - all of RAM which I have. This is not what I want to provide for it. There should be the way to set limits for resource usage, which proxy will honor. Same applies for Tor.
I don’t know if recent memory usage spike was due to attack or specific usage pattern, but here is what I found in logs. Maybe it will help:
2022/08/09 07:06:44 Traffic throughput (up|down): 8 GB|354 MB -- (949383 OnMessages, 6687498 Sends, over 21085 seconds)
If the snowflake RC file uses the same memory switch as tor does, add this line to your config file and restart your tor and snowflake service
MaxMemInQueues 6GB (use another size if you want)
As far as I can see, Snowflake proxy do not use configuration files.
It is configured with command line parameters, which have no options to limit memory usage.
In a terminal run proxy -v. This will show you commands you can use. Looks like “-capacity uint” lets you set “maximum concurrent clients”. Maybe that would help?
···
On Aug 9, 2022, at 8:37 AM, Vort via Tor Project Forum notifications_at_torproject1_discoursemail_com_7symmg8vsw4428_0a0598b2@icloud.com wrote:
| Vort
August 9 |
- | - |
Mephistopheles:
snowflake RC file
As far as I can see, Snowflake proxy do not use configuration files.
It is configured with command line parameters, which have no options to limit memory usage.
Visit Topic or reply to this email to respond.
To unsubscribe from these emails, click here.
I see. Ok, my apologies. I should have read a bit closer before.
Did you compile from docker or ansible? What browser are you running? And what OS are you running?
This may, or may not apply to you, but its worth giving a look anyway. Tor Project | Ansible role
Specifically, note the 8th (Optional) instruction step.
‘’’ You can limit the number of clients (Snowflake users) by using the variable client. The maximum concurrent clients by default is unlimited (0 = non limit).
‘’’
The playbook below has a limit of 300 concurrent clients:
- hosts: snowflake
   vars:
    clients: 300
  roles:
     - nvjacobo.snowflake
Might give that a whirl and see what happens, but from what I currently understand, this attaches to your browser, most of which are notorious for eating shitloads of memory depending on the process, code on the page being viewed, and the browser itself.
Instead of limiting memory usage, which doesn’t appear to be possible at the moment, try limiting concurrent client connections like shown above and see if that helps any at all.
Please, if you don’t mind, post the debug logs that are of interest.
1 Like
I suspect that proxy overload happened because of single “bad” connection.
If that is the case, such limit will not help.
Usual proxy load is ~100MB of RAM, so other clients did not contributed much resource usage.
Which of course won’t help if it’s just one client.
If I recall correctly, running proxy in a Docker container has the advantage in that Docker for desktop will let you limit memory usage. Of course, Docker itself is a memory hog. This is on MacOS so your milage may vary. ¯_(ツ)_/¯
···
Sent from the unceded territories of the xwməθkwəy̓əm (Musqueam), Skwxwú7mesh (Squamish), Stó:lō and Səl̓ílwətaʔ/Selilwitulh (Tsleil- Waututh) People
On Aug 9, 2022, at 8:49 AM, Mark Charnell markcharn3ll@icloud.com wrote:
In a terminal run proxy -v. This will show you commands you can use. Looks like “-capacity uint” lets you set “maximum concurrent clients”. Maybe that would help?
On Aug 9, 2022, at 8:37 AM, Vort via Tor Project Forum notifications_at_torproject1_discoursemail_com_7symmg8vsw4428_0a0598b2@icloud.com wrote:
August 9 |
- | - |
snowflake RC file
As far as I can see, Snowflake proxy do not use configuration files.
It is configured with command line parameters, which have no options to limit memory usage.
Visit Topic or reply to this email to respond.
To unsubscribe from these emails, click here.
1 Like
- From Git.
- It should not matter.
- Windows 7 SP1 x64.
Problems started to appear at ~6:30 of local time (3:30 UTC, as in logs)
At ~10:30 local time RAM usage reverted to ~1GB (did not measured).
So I’m publishing logs from 1:00 UTC to 10:00 UTC 2022.08.09.
log_crop.txt (250.1 КБ)
Total memory consumption for whole system:
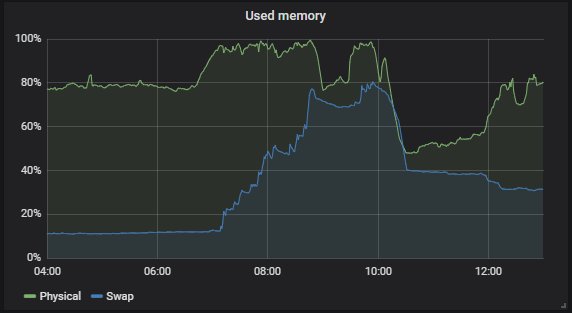
Ok, we have a hack, thanks.
But it is much better to solve the problem in the place where it originates - in proxy binary.
If it is in fact due to a single bad connection, that one connection shouldn’t even be capable of eating that much ram, unless its hung on requesting or getting a piece of data it thinks It has to have and resends requests until the buffer is full.
Though this technically outside the scope of tor, fire up the proxy and run Wireshark in promiscuous capture mode on the adapter hosting the proxy. I don’t know exactly what your looking for, but patterns of repeating requests and data getting hung should be fairly (hopefully) obvious in most cases. See if Wireshark can tell you where to look.
Also, run a netstat while the proxy is running and see how many concurrent sockets your machine is communicating on. Too many active sockets in a wait, or active state that aren’t being used could potentially eat a shitload of memory.
If your running this proxy on macOS, macOS has a sometimes wonderful feature known as inactive memory, which is different than what it sounds like.
Example: Compiling source with gnu make, or cmake needs memory (obviously) but say your build fails for whatever reason, you fix it, tweak, and run the make again, and again, and again. Eventually macOS sets that block of memory aside for just the gnu make and Xcode tools so they are loaded into memory and ready for use the moment you need them again. This may be what’s happening to you, restart your Mac 4 times (yes 4 times, no seriously)
If you aren’t running macOS, then this will most likely be irrelevant to you.
Hmm. Been checking out those logs for a few minutes and I see what you mean, and its subtle and weird too. Note these few lines in particular
2022/08/09 07:06:44 Traffic throughput (up|down): 8 GB|354 MB – (949383 OnMessages, 6687498 Sends, over 21085 seconds)
2022/08/09 01:57:43 Traffic throughput (up|down): 836 MB|37 MB – (114469 OnMessages, 685198 Sends, over 3089 seconds)
Is it possible that someone streaming a download could have done this? 21085 seconds shakes out to around 6 hours. What’s particularly interesting is that the chart suggests that it built up slowly overtime, which suggests a buffer issue of some sort.
What sort of bandwidth are you working with? If your UP speed isn’t up to the challenge, I could see it trying to store a lot in buffer until the upload finishes before purging it from memory. Though if Im wrong on this point, someone please step up and correct me.
Im going to compile and run this when I get home tonight and see if I can recreate this issue and figure out where it originates
1 Like
Windows have similar feature too. It works for open files (including binaries) - so program loads instantly from RAM instead being read from the disk. But Snowflake have no open files and its binary is relatively small.
That problematic connection is closed long time ago.
Setting Wireshark for capture 24/7 looks like recipe for the problems.
But I will try to make capture if RAM usage start to rise again.
However, I did not analyzed WebRTC packets yet so not sure that I will be able to see what exactly went wrong.
Same answer as for Wireshark - now memory usage is fine, nothing to look at right now.
But I think that large connection count is unrealistic scenario: I’m tracking TCP active connection count and there are no spikes on chart for them (if I understand correctly, Snowflake need to have not only UDP socket for proxification, but also corresponding TCP one).
100 Mbit/s up / 100 Mbit/s down.
Part of it used by Tor and other services on my computer.
8 GB is almost nothing for my connection → such file can be downloaded in 12 minutes.
Even with 5x slower speeds - it should take 1 hour and not 6 hours.
Definitely not a lack of bandwidth issue then, symmetrical 100Mbit should be enough 4x over and then some.
My gut tells me its a handoff issue between the process and the OS, either that or its paging packets its getting hung on sending, and retransmitting until the buffer is full and forces the OS to page the process to swap until the full upload is finished.
Technical Overview · Wiki · The Tor Project / Anti-censorship / Pluggable Transports / Snowflake · GitLab seems to agree with me to an extent
Building with Tor Browser Bundle
This section is a work in progress. The process for reproducibly building snowflake with Tor has determined reliable reproducible builds on Linux, but not yet on OSX or Windows.
Windows 7 has been dead and gone for a long time, have you tried with any other OS?
Also, I don’t blame you for not wanting to Wireshark or netstat, turbo aneurism from info overload, that and it would probably melt your DIMM slots if you tried capturing more than a gig or 2 of traffic at a time. Something id like to mention though, tshark is the command line variant of Wireshark, and uses much much less memory when capturing. Id still recommend trying. tshark has a number of switches that can be used to reduce file size output and active memory usage. Capturing in file blocks of 512MB before writing to another file has been a tried and true method.
Example
tshark -b filesize:1000 -b files:5
Quoted from tshark(1)
-b indicates ring buffer, filesize:1000 indicates write no more than 1MB of data to the file before moving onto the next, and files:5 indicates write to no more than 5 files and then stop the capture.
by using this method to break up cap files and the Wireshark/tshark capture process to only using a much much smaller amount of memory.
you can also use wireshark/tshark to capture remotely to a different machine, see How can I sniff the traffic of remote machine with wireshark? - Server Fault
It may also be worth building on a linux machine and see if you get the same issue if your able.
1 Like
Tangentially related perhaps:
1 Like
From what I know, OS buffers are not that large.
I think that excessive memory consumption happens in “user” space.
By the way, proxy process survived and it is possible to look at information about it provided by OS. Problem shows in Peak Private Bytes and Peak Working Set values.
I don’t know if these values contain both “user” and OS buffers or only user ones. I hope that someone who understand better can say it.

It have properties which I can’t find in other OSes, so I don’t want to change it.
I use other OSes for testing, but in this case, reproducibility is low, so no sense to try running proxy in virtual machine.
Also I may try to add filters to capture only Snowflake packets and not Tor packets for example.
If problem start repeating, I will try to do that. However, Snowflake packets should be encrypted, so I can analyze only metadata, which may be not that much useful.
At least I can track IP address of problematic user and ban him ![]()
I noticed suggestion to run proxy with -verbose setting there, but I can see no differences in logs between proxy.exe -log log.txt and proxy.exe -verbose -log log_verbose.txt. Did I found yet another bug?
Also I may try to add filters to capture only Snowflake packets and not Tor packets for example.
If problem start repeating, I will try to do that. However, Snowflake packets should be encrypted, so I can analyze only metadata, which may be not that much useful.
At least I can track IP address of problematic user and ban him
Metadata should be enough, excellent.
Probably, or it may be that it only spits out what tor lets it, NYX sometimes does this, even if you tell it to log more, it won’t unless you enable the same logging measures in ~/etc/torrc .
You may try to enable debug logging on tor and see if that helps. If not, then bug report it
Windows isn’t my strong suite, so I hesitate to speculate. But you are correct, reproducibility is low. I tried with a VM and shit, and couldn’t get it to flag the way yours seems to.
Very possible. There are a lot of similarities in behavior, the only difference being OS and version.
I don’t think were going to catch this bug after the fact. Enable debug level logs on both the proxy and tor, and run that ring buffer tshark cap I mentioned earlier and let it run until it has another meltdown. At least then we’ll have logs to point us in the right direction. If you can introduce a filter that logs snowflake only, that will help a lot here.
Ill keep running the proxy on my side and gather some debug logs and see if I can find a similar issue. Because I think your right, I don’t think the OS buffer would be capable of this.
Also, you may try attaching a debugger to the proxy process and see if that yields any useful information. Though ill admit, I don’t know how to do so in windows 7, but it may be worth thinking about anyway.
I’m 99% sure that Snowflake proxy do not touch my HDD at all.
That is how programs usually work except for malware, which may scan your passwords even if you don’t ask it to do this.
Staring at source code sometimes helps.
Not the best option, but it exists nevertheless.
I have better idea - to make process dump when problem starts to appear.
It is powerful method for finding sources of problems.
But I very rarely see developers’ desire to analyze dumps.
And when they do not want - I have no enthusiasm to do that too.
Since no one else is reporting similar problem, it may be not attack, but random glitch. Which means that waiting for it to happen again may take too much time.
Other explanation is that attack is active, but proxy owners do not know/care about this problem.
I go with random glitch on one broker. Try throwing “snowflake broker race condition” into your favorite search engine. Then again…¯_(ツ)_/¯
And please keep in mind that the snowflake team is a vanishingly small number of people for such an endeavor.
Cheers!
I don’t see how crash in server can be related to increased RAM usage in client.
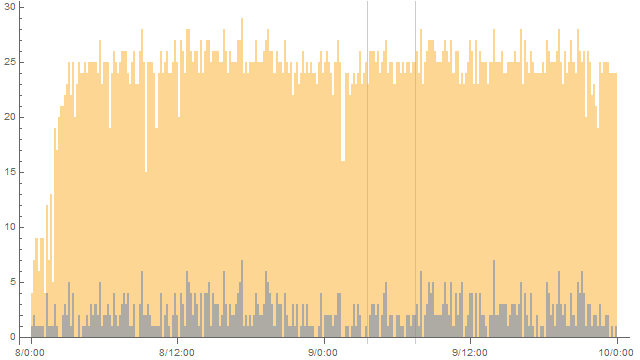
After looking at Snowflake operation in more detail, I decided to visualize connection logs from 2022.08.09 (and 2022.08.08 for comparison).
Yellow is “sdp offer successfully received” count, blue is “Connection successful” count.
Nothing unusual showed up:
By the way, now proxy uses 1 GB of RAM, having 13 connections to snowflake-01.torproject.net while bandwidth use is ranging from ~5KB/s to ~500KB/s.
I doubt that ~75 MB of RAM usage per connection (while most of them are idle) is normal performance of proxy.
Maybe memory leak is happening? Theoretically I can disconnect clients and look if memory usage will drop to zero, but I do not want to do this yet.