I’m running Tor with MaxMemInQueues 1 GB for many years.
But today I noticed that Tor process uses 2 GiB of RAM.
What kind of data Tor may store, which is not limited by MaxMemInQueues?
Is it related to latest attacks?
I guess that increase in consumed memory could have happened today at 01:00 UTC, but I’m not sure, I’m not monitoring it directly.
Selection of 75% of total memory is a strange decision.
Tor easily exceeds 1.33 (1 / 0.75) of MaxMemInQueues.
My record is 3.5 GiB working set with MaxMemInQueues 1 GB.
For selecting of the best value for MaxMemInQueues it is better to know at least approximate formula for maximum total memory consumption of Tor process.
With 0.4.7.8 version maximum working set was somewhere near 4.5 GiB.
Then 0.4.7.10 was released and for ~month maximum RAM usage was around 1.6 GiB.
Last week RAM usage started to crawl up and today it is 4.4 GiB again.
Do we need 0.4.7.11 to solve this problem?
1 year passed, no improvements can be seen.
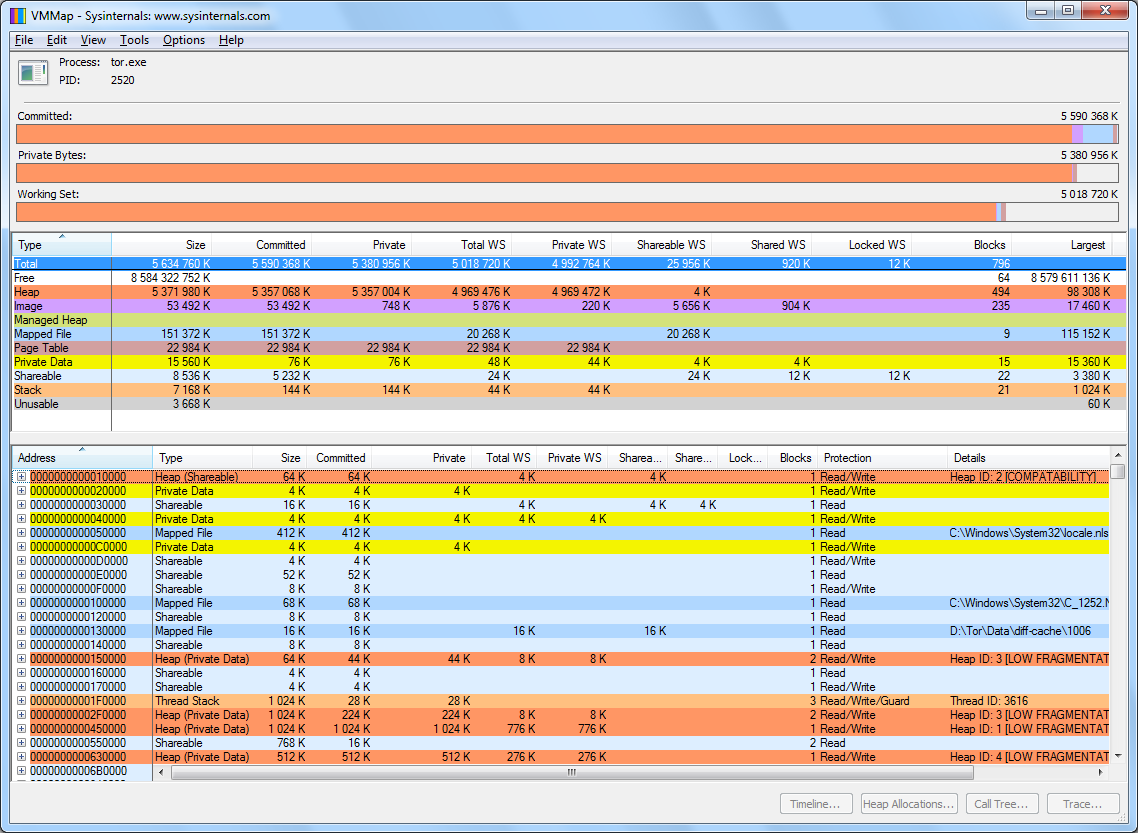
Yesterday DDoS attack on my 0.4.8.9 relay began.
Despite having MaxMemInQueues 512 MB and RelayBandwidthRate 4 MBytes options, tor.exe RAM consumption increased to 5380 MB.
Looks like Tor have memory leaks.
Messages about memory freeing appear in logs, but it does not help to contain RAM consumption growth.
Dec 07 08:10:57.000 [notice] We're low on memory (cell queues total alloc: 373453872 buffer total alloc: 140982272, tor compress total alloc: 0 (zlib: 0, zstd: 0, lzma: 0), rendezvous cache total alloc: 23505346). Killing circuits withover-long queues. (This behavior is controlled by MaxMemInQueues.) Dec 07 08:10:58.000 [notice] Removed 56827584 bytes by killing 4152 circuits; 1530162 circuits remain alive. Also killed 0 non-linked directory connections. Killed 0 edge connections
Here is new info regarding overload event for my relay.
After RAM consumption reached 5 GB, I restarted Tor service.
Instantly RAM consumption began to grow again.
When it reached 3 GB, I noticed that alive circuit count start dropping (returning to normal values), indicating that overload went away.
Then I restarted node again to clear mess in RAM and after that consumption stabilized at usual value of 600 MB.
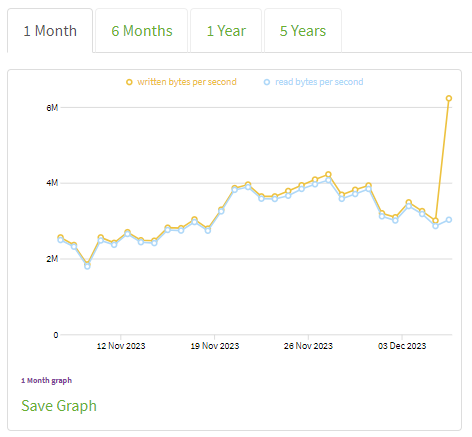
Recently Metrics published fresh charts for traffic consumption and I can see how event reflected there for my relay:
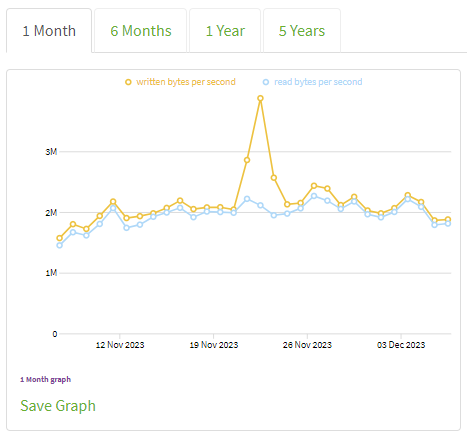
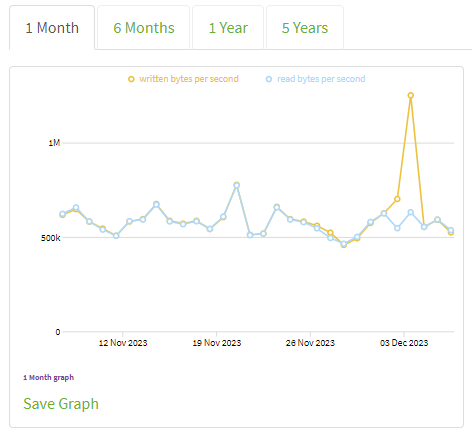
I decided to check if other relays had similar spikes and result was positive: