After the recent update I can see the amount of data processed per hour varies more wildly and (now I have the theory) it may be because the connections live longer, if clients needed to reconnect more, the load would be more evenly distributed among proxies, now that you ‘hold on’ to your clients, depending on their activity which presumably various wildly per user you will see this reflected in the bandwidth stats.
1 Like
My apologies for not responding sooner. I was dealing with other projects and I had to put this on the back burner.
To give you an update and also to give you a more accurate picture of my setup, I’m running my snowflakes on a bare metal and under several VMs. Each virtual machine has its own IP address and operating system and runs 5 docker containers / snowflake proxies. I must also admit that my network does have unusually good connectivity and attracts a lot of Iranian users who may not be able to connect to other setups as you will see in my logs later in this post. Currently each 5 container setup relays just about as much traffic as a Tor relay with Max Advertised bandwidth of 15 MiB which is cool.
I’m sure the memory leak is there which means the memory usage goes up when the activities are high, which is understandable, but the memory doesn’t fully recover when things cool down. This leads to the eventual OOM crash.
The good part is that the whole VM doesn’t crash. Only the containers and they do so one at a time, couple of hours apart so the rest of them keep on relaying. and the ones that crash, restart by themselves immediately and keep going. This is only noticeable if you’re monitoring the memory as it partially drops when one of the containers restart. You can also notice this in the log which only indicates the restart with no other clue. Aside from that, there are no error messages in the docker logs. You can only see an indication of oom kill and disconnected shim in the system logs :
Mar 21 10:29:59 vpn kernel: oom-kill:constraint=CONSTRAINT_NONE,nodemask=(null),cpuset=f5dec5eb8a4034e22bbc3a5eb2b038e918f645d786d9de614375e13635bf7fe5,mems_allowed=0,global_oom,task_memcg=/docker/039c643a0198f2d378c3515538d053a38873408b526cc3134923b9b07f8ef971,task=proxy,pid=8477,uid=1000
Mar 21 10:29:59 vpn kernel: Out of memory: Killed process 8477 (proxy) total-vm:2375972kB, anon-rss:904156kB, file-rss:1720kB, shmem-rss:0kB, UID:1000 pgtables:3448kB oom_score_adj:0
Mar 21 10:29:59 vpn containerd[853]: time="2023-03-21T10:29:59.599814434Z" level=info msg="shim disconnected" id=039c643a0198f2d378c3515538d053a38873408b526cc3134923b9b07f8ef971
Mar 21 10:29:59 vpn containerd[853]: time="2023-03-21T10:29:59.603234663Z" level=warning msg="cleaning up after shim disconnected" id=039c643a0198f2d378c3515538d053a38873408b526cc3134923b9b07f8ef971 namespace=moby
Mar 21 10:29:59 vpn containerd[853]: time="2023-03-21T10:29:59.603479972Z" level=info msg="cleaning up dead shim"
Mar 21 10:29:59 vpn dockerd[1185]: time="2023-03-21T10:29:59.602807645Z" level=info msg="ignoring event" container=039c643a0198f2d378c3515538d053a38873408b526cc3134923b9b07f8ef971 module=libcontainerd namespace=moby topic=/tasks/delete type="*events.TaskDelete"
Mar 21 10:29:59 vpn containerd[853]: time="2023-03-21T10:29:59.626274657Z" level=warning msg="cleanup warnings time=\"2023-03-21T10:29:59Z\" level=info msg=\"starting signal loop\" namespace=moby pid=9028 runtime=io.containerd.runc.v2\n"
Mar 21 10:29:59 vpn systemd[1]: var-lib-docker-overlay2-8a4cc8ea209ea49b8d28e7d573968499aa122988853a6ea0eca9450758c7bb2a-merged.mount: Succeeded.
Mar 21 10:29:59 vpn containerd[853]: time="2023-03-21T10:29:59.919039358Z" level=info msg="loading plugin \"io.containerd.event.v1.publisher\"..." runtime=io.containerd.runc.v2 type=io.containerd.event.v1
Mar 21 10:29:59 vpn containerd[853]: time="2023-03-21T10:29:59.919108918Z" level=info msg="loading plugin \"io.containerd.internal.v1.shutdown\"..." runtime=io.containerd.runc.v2 type=io.containerd.internal.v1
Mar 21 10:29:59 vpn containerd[853]: time="2023-03-21T10:29:59.919125321Z" level=info msg="loading plugin \"io.containerd.ttrpc.v1.task\"..." runtime=io.containerd.runc.v2 type=io.containerd.ttrpc.v1
Mar 21 10:29:59 vpn containerd[853]: time="2023-03-21T10:29:59.919381751Z" level=info msg="starting signal loop" namespace=moby path=/run/containerd/io.containerd.runtime.v2.task/moby/039c643a0198f2d378c3515538d053a38873408b526cc3134923b9b07f8ef971 pid=9048 runtime=io.containerd.runc.v2
And to get a better picture of the kind of connections, this is the log for one of the containers out of 5 on one of the VMs:
2023/03/23 05:29:32 Proxy starting
2023/03/23 05:29:39 NAT type: unrestricted
2023/03/23 06:29:32 In the last 1h0m0s, there were 151 connections. Traffic Relayed ↑ 1672090 KB, ↓ 201928 KB.
2023/03/23 07:29:32 In the last 1h0m0s, there were 184 connections. Traffic Relayed ↑ 3237160 KB, ↓ 397758 KB.
2023/03/23 08:29:32 In the last 1h0m0s, there were 220 connections. Traffic Relayed ↑ 4426205 KB, ↓ 577664 KB.
2023/03/23 09:29:32 In the last 1h0m0s, there were 240 connections. Traffic Relayed ↑ 6414385 KB, ↓ 925416 KB.
2023/03/23 10:29:32 In the last 1h0m0s, there were 245 connections. Traffic Relayed ↑ 5536270 KB, ↓ 832924 KB.
2023/03/23 11:29:32 In the last 1h0m0s, there were 256 connections. Traffic Relayed ↑ 3594474 KB, ↓ 618120 KB.
2023/03/23 12:29:32 In the last 1h0m0s, there were 239 connections. Traffic Relayed ↑ 4400832 KB, ↓ 631875 KB.
2023/03/23 13:29:32 In the last 1h0m0s, there were 255 connections. Traffic Relayed ↑ 6612566 KB, ↓ 792439 KB.
2023/03/23 14:29:32 In the last 1h0m0s, there were 259 connections. Traffic Relayed ↑ 6693017 KB, ↓ 767227 KB.
2023/03/23 15:29:32 In the last 1h0m0s, there were 288 connections. Traffic Relayed ↑ 9075662 KB, ↓ 1082406 KB.
2023/03/23 16:29:32 In the last 1h0m0s, there were 305 connections. Traffic Relayed ↑ 11216653 KB, ↓ 1283160 KB.
The last line shows over 11 GB of data transfer in one hour. And this is a snapshot of the current unique IP addresses with ASSURED UDP status in my conntrack table and where they’re coming from:
      1 Chile
      2 China
      1 Ecuador
      1 Finland
      2 France
      4 Germany
    576 Iran
      1 Italy
      1 Japan
      1 Lithuania
      1 Netherlands
      6 Russia
      1 Ukraine
      3 United States
It was also suggested that I should reduce the number of connections to see how that works. Here’s an example of another container:
2023/03/23 10:16:09 Proxy starting
2023/03/23 10:16:21 NAT type: unrestricted
2023/03/23 11:16:09 In the last 1h0m0s, there were 32 connections. Traffic Relayed ↑ 266465 KB, ↓ 45634 KB.
2023/03/23 12:16:09 In the last 1h0m0s, there were 34 connections. Traffic Relayed ↑ 890410 KB, ↓ 92998 KB.
2023/03/23 13:16:09 In the last 1h0m0s, there were 55 connections. Traffic Relayed ↑ 701485 KB, ↓ 80086 KB.
2023/03/23 14:16:09 In the last 1h0m0s, there were 67 connections. Traffic Relayed ↑ 1369366 KB, ↓ 186713 KB.
2023/03/23 15:16:09 In the last 1h0m0s, there were 50 connections. Traffic Relayed ↑ 1402332 KB, ↓ 175346 KB.
2023/03/23 16:16:09 In the last 1h0m0s, there were 48 connections. Traffic Relayed ↑ 455562 KB, ↓ 74556 KB.
2023/03/23 17:16:09 In the last 1h0m0s, there were 56 connections. Traffic Relayed ↑ 1100026 KB, ↓ 163992 KB.
And the conntrack:
      1 Canada
      1 China
      2 Finland
      2 Germany
     30 Iran
      1 Mexico
      6 Russia
      1 Ukraine
      6 United States
I’m afraid the problem is still there. The crashes may happen less frequently but they do happen
nevertheless.
Cheers.
I have similar connection counts and traffic with my 100Mbit/s connection, overloaded by lots of services:
2023/03/23 06:39:23 In the last 1h0m0s, there were 98 connections. Traffic Relayed ↓ 2439491 KB, ↑ 351650 KB.
2023/03/23 07:39:23 In the last 1h0m0s, there were 196 connections. Traffic Relayed ↓ 3698258 KB, ↑ 554888 KB.
2023/03/23 08:39:23 In the last 1h0m0s, there were 306 connections. Traffic Relayed ↓ 9011406 KB, ↑ 1081349 KB.
2023/03/23 09:39:23 In the last 1h0m0s, there were 236 connections. Traffic Relayed ↓ 4165945 KB, ↑ 500628 KB.
2023/03/23 10:39:23 In the last 1h0m0s, there were 378 connections. Traffic Relayed ↓ 6172382 KB, ↑ 859606 KB.
2023/03/23 11:39:23 In the last 1h0m0s, there were 192 connections. Traffic Relayed ↓ 1473890 KB, ↑ 310851 KB.
2023/03/23 12:39:23 In the last 1h0m0s, there were 225 connections. Traffic Relayed ↓ 3324096 KB, ↑ 498555 KB.
2023/03/23 13:39:23 In the last 1h0m0s, there were 276 connections. Traffic Relayed ↓ 4554454 KB, ↑ 608007 KB.
2023/03/23 14:39:23 In the last 1h0m0s, there were 261 connections. Traffic Relayed ↓ 4818077 KB, ↑ 576863 KB.
2023/03/23 15:39:23 In the last 1h0m0s, there were 321 connections. Traffic Relayed ↓ 5002267 KB, ↑ 694855 KB.
2023/03/23 16:39:23 In the last 1h0m0s, there were 273 connections. Traffic Relayed ↓ 6212287 KB, ↑ 926834 KB.
2023/03/23 17:39:23 In the last 1h0m0s, there were 299 connections. Traffic Relayed ↓ 4974425 KB, ↑ 664037 KB.
2023/03/23 18:39:23 In the last 1h0m0s, there were 314 connections. Traffic Relayed ↓ 4986995 KB, ↑ 794483 KB.
2023/03/23 19:39:23 In the last 1h0m0s, there were 401 connections. Traffic Relayed ↓ 9977746 KB, ↑ 1488440 KB.
2023/03/23 20:39:23 In the last 1h0m0s, there were 224 connections. Traffic Relayed ↓ 1397196 KB, ↑ 310304 KB.
2023/03/23 21:39:23 In the last 1h0m0s, there were 284 connections. Traffic Relayed ↓ 3008116 KB, ↑ 550419 KB.
And I confirm that leak can make process grow up to 2 gigs, looks like the same amount is allowed for your container: total-vm:2375972kB.
However, it is most importantly to figure out how memory consumption behaves over the time.
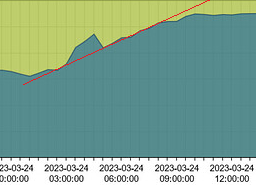
If chart with used memory over time looks like oblique line, then it’s a most obvious sign of memory leak.
If chart look like logarithmic function, then there are two possibilities - it is either leak, as with previous shape, or normal operation of memory-hungry application. With just high consumption of RAM, what should be done is optimization, when in cases of leaks it needs bug fixing.
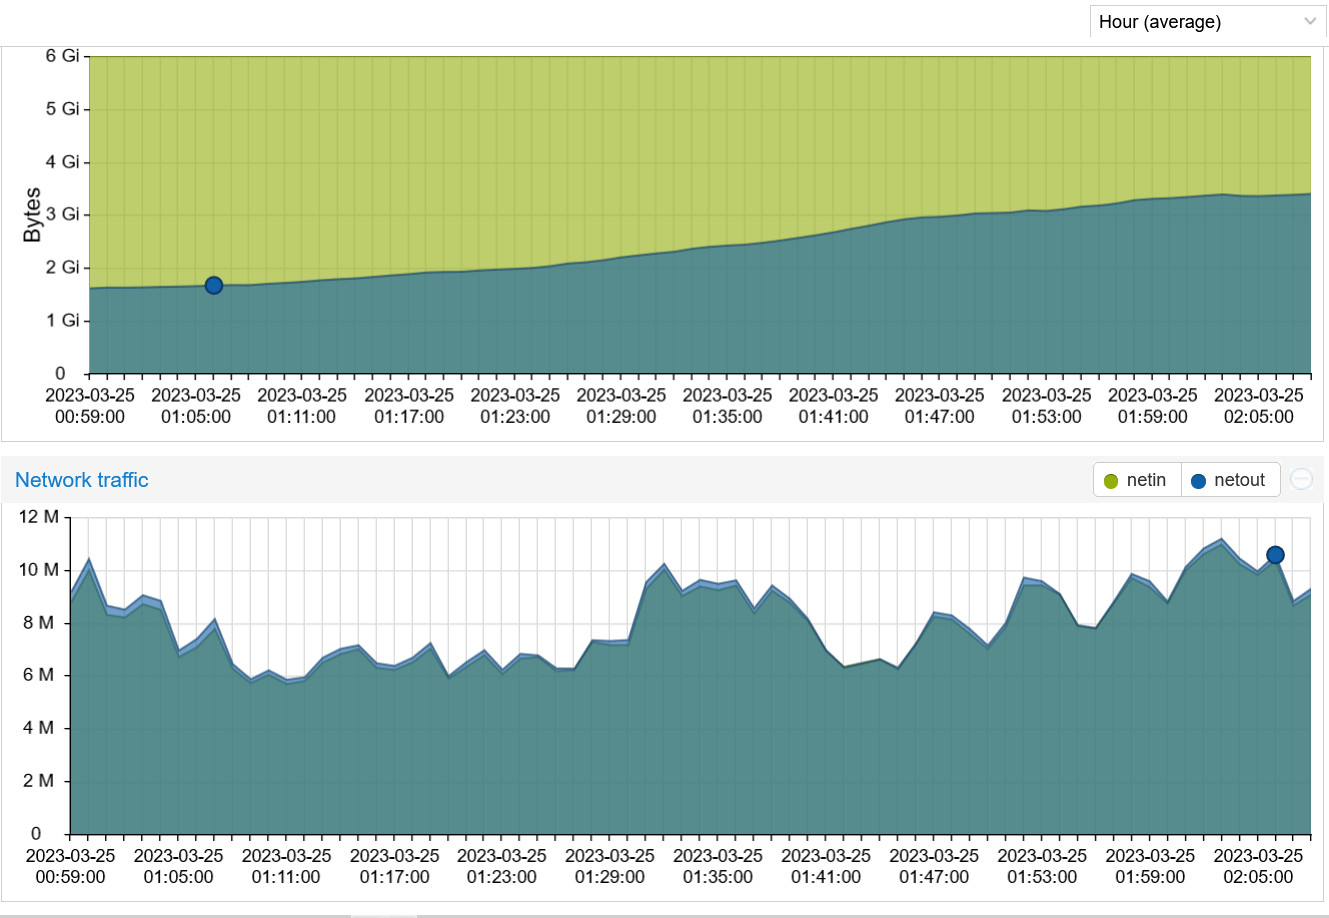
And this is a chart after a complete reboot. The 5 containers combined were happily relaying 10 M of traffic using 1.36 GB of RAM. About two hours later, they are doing the same job using 3.6 GB of RAM. In a few hours the system will be using over 5 GB of RAM. To me, this indicates that the used RAM is not being properly released once the job is done and each job is piled up on top of the previous jobs.
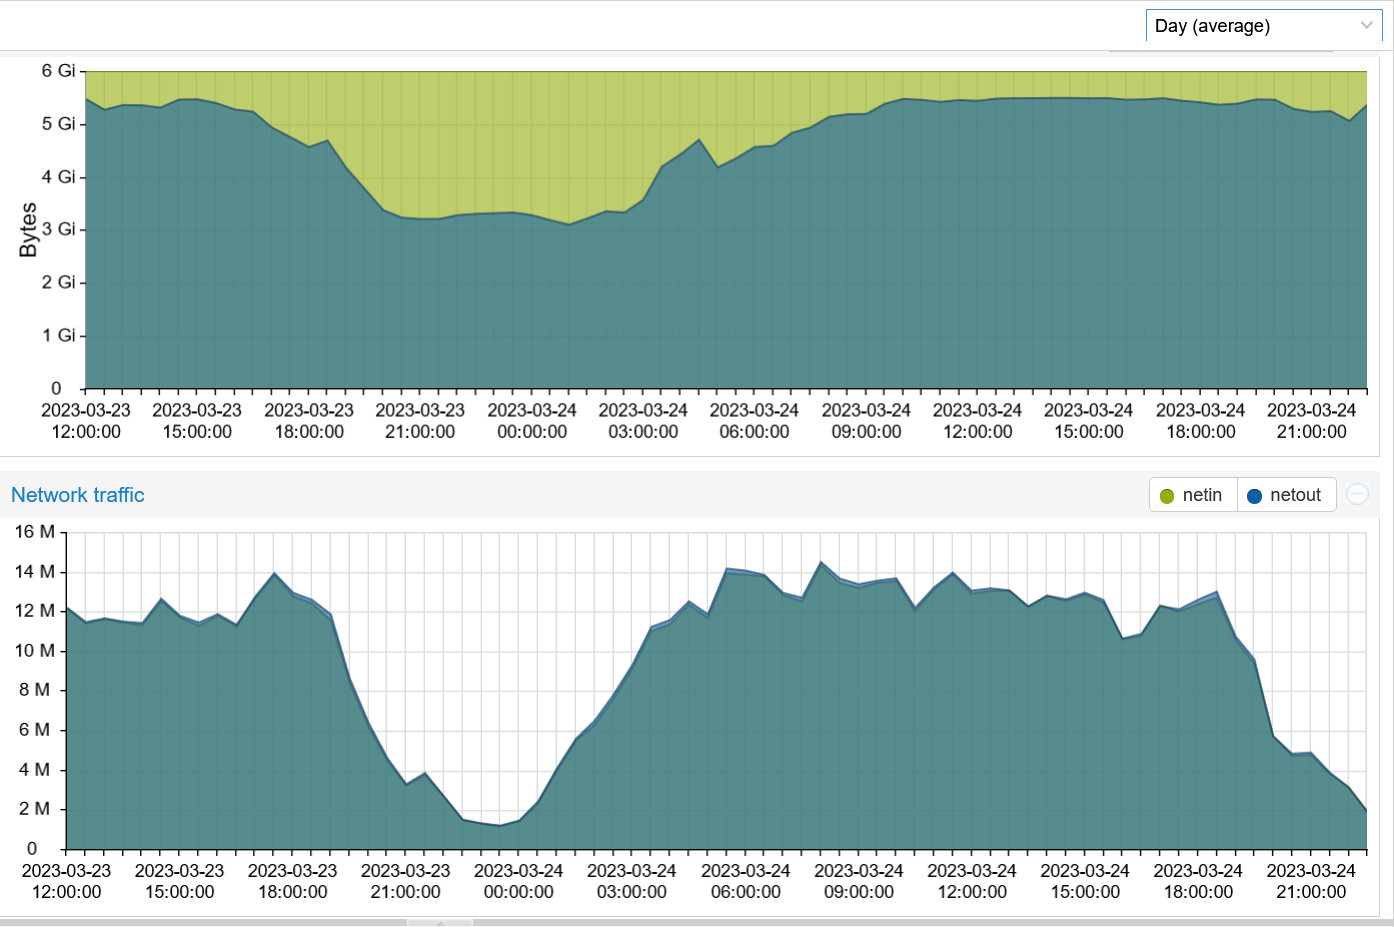
Here’s a chart of memory usage and data transfer. The dip on the left is when the containers were restarted. Note the memory usage when I was relaying 14 M and about 3 hours after the slow time when I was only relaying 4 M. The RAM usage stays the same and won’t recover. In fact It’s using even a bit more.
1 Like
It looks like line for some time:
Then your system probably starts compacting RAM somehow.
It may happen because buffers are not cleared.
But it is not clear sign of leak.
Buffers may expand to certain size, but then stay at the same level.
Looks like your configuration do not allow to get clean data ![]() - consumption hits some limit, set by operating system.
- consumption hits some limit, set by operating system.
My new personal record is 3 gigs per single process, with 193 simultaneous connections.
It means 16 megabytes per each user, I think it is too much no matter if it is leak or not.
I decided to look how to collect data from process itself.
And it turned out quite easy.
Basically, two imports should be added and http server should be started:
Code modifications to proxy\main.go
...
	"net/http"
	_ "net/http/pprof"
...
func main() {
	go func() {
		http.ListenAndServe("localhost:6061", nil)
	}()
...
I collected data from proxy with ~2 hours uptime.
It uses 298 MiB of RAM (by information from OS) and serves 141 clients.
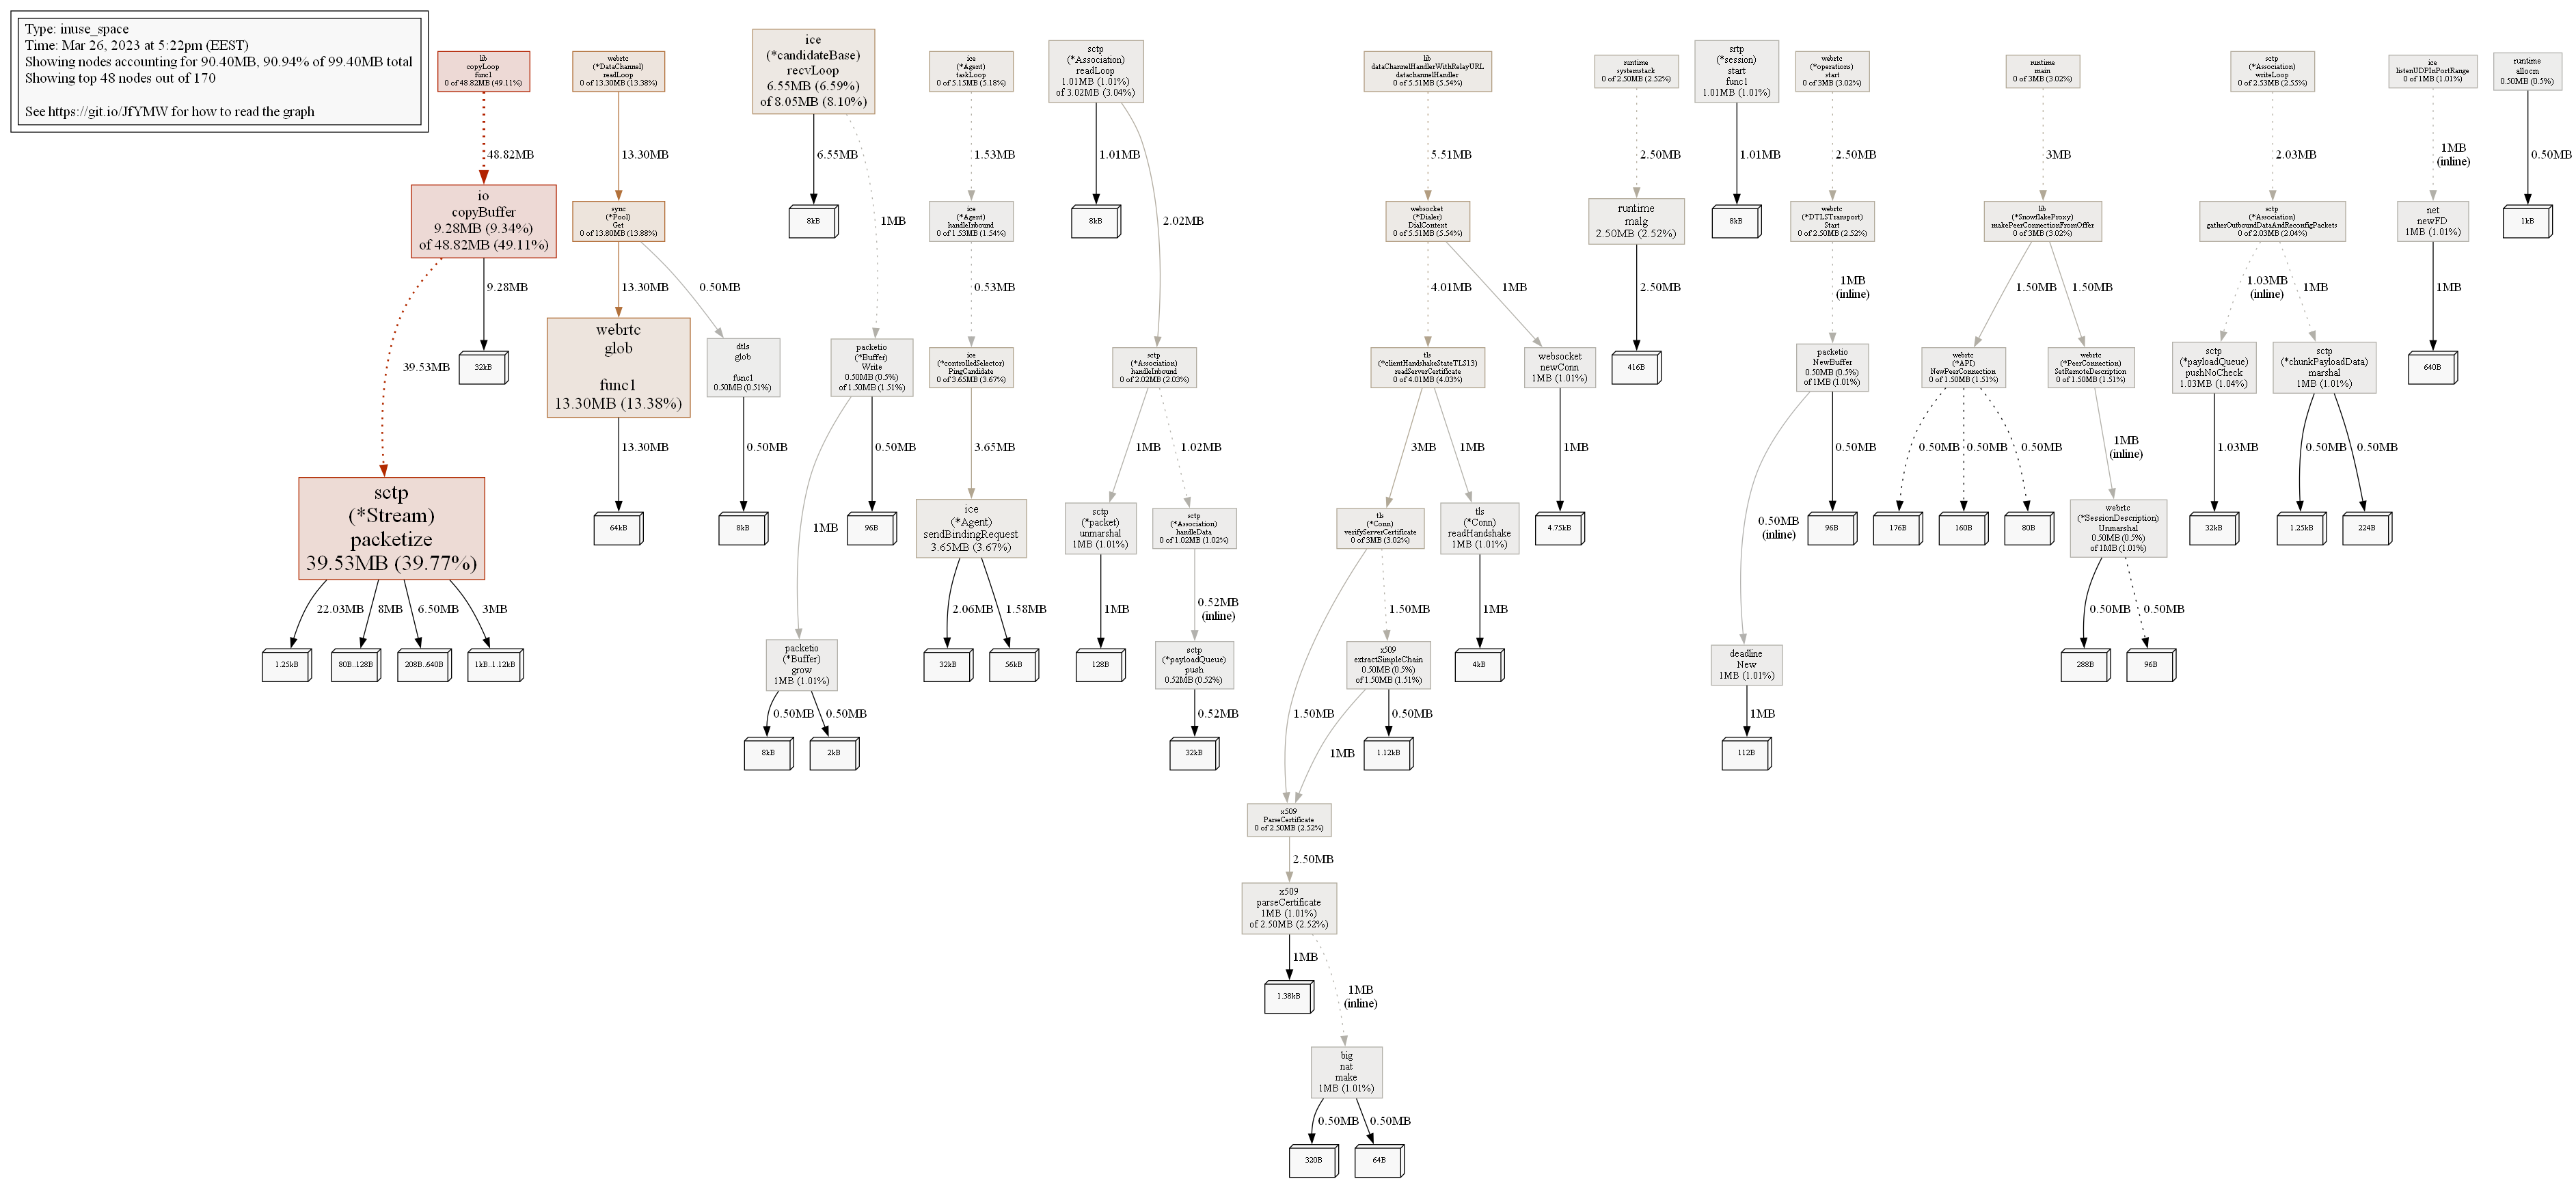
Here is how heap and goroutines dumps looks:
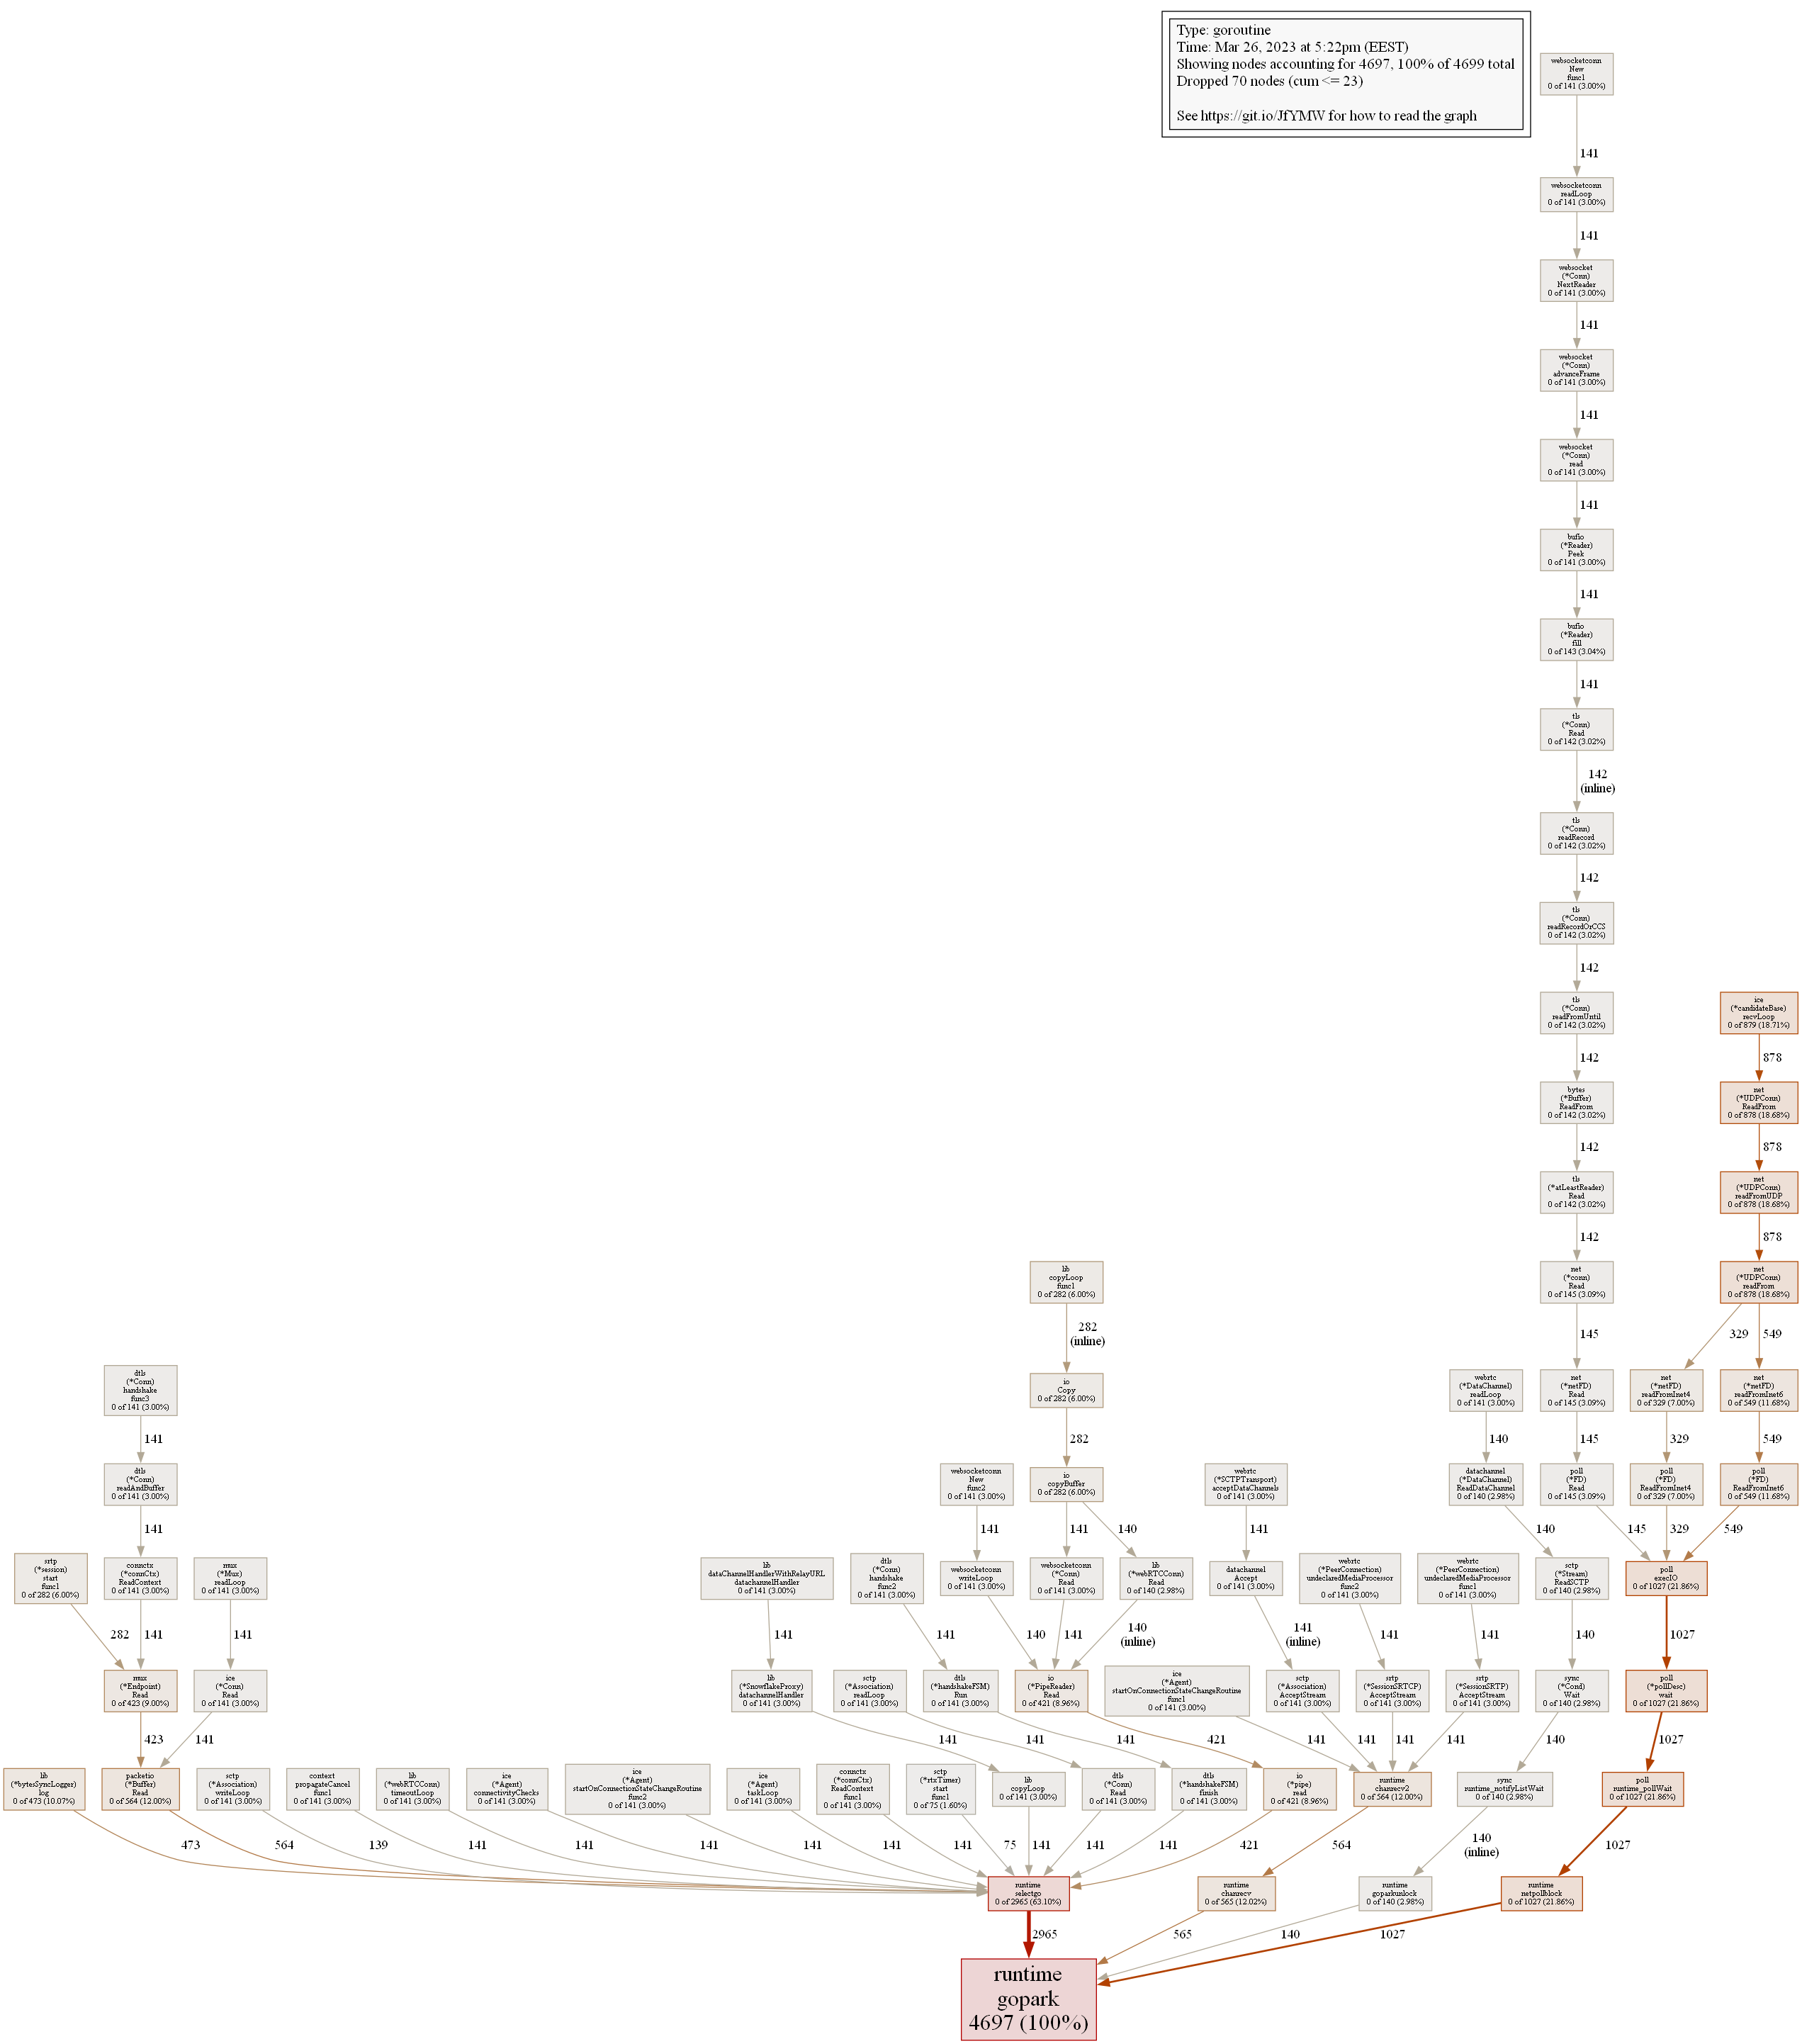
It looks strange for me for example that ReadFromInet6 is used in 549 goroutines, while only 141 clients are served. But I don’t know Go, and it is easier for developers to understand what happens in their program.
I plan to wait until process grows to at least 1 GB and compare how charts will look. However it requires to have stable electricity supply, which is often not the case for me.
upd. I decided to post new data before reaching 1 GB.
Right now RAM usage is 748 MB and proxy have 112 users connected.
Dumps looks like this:
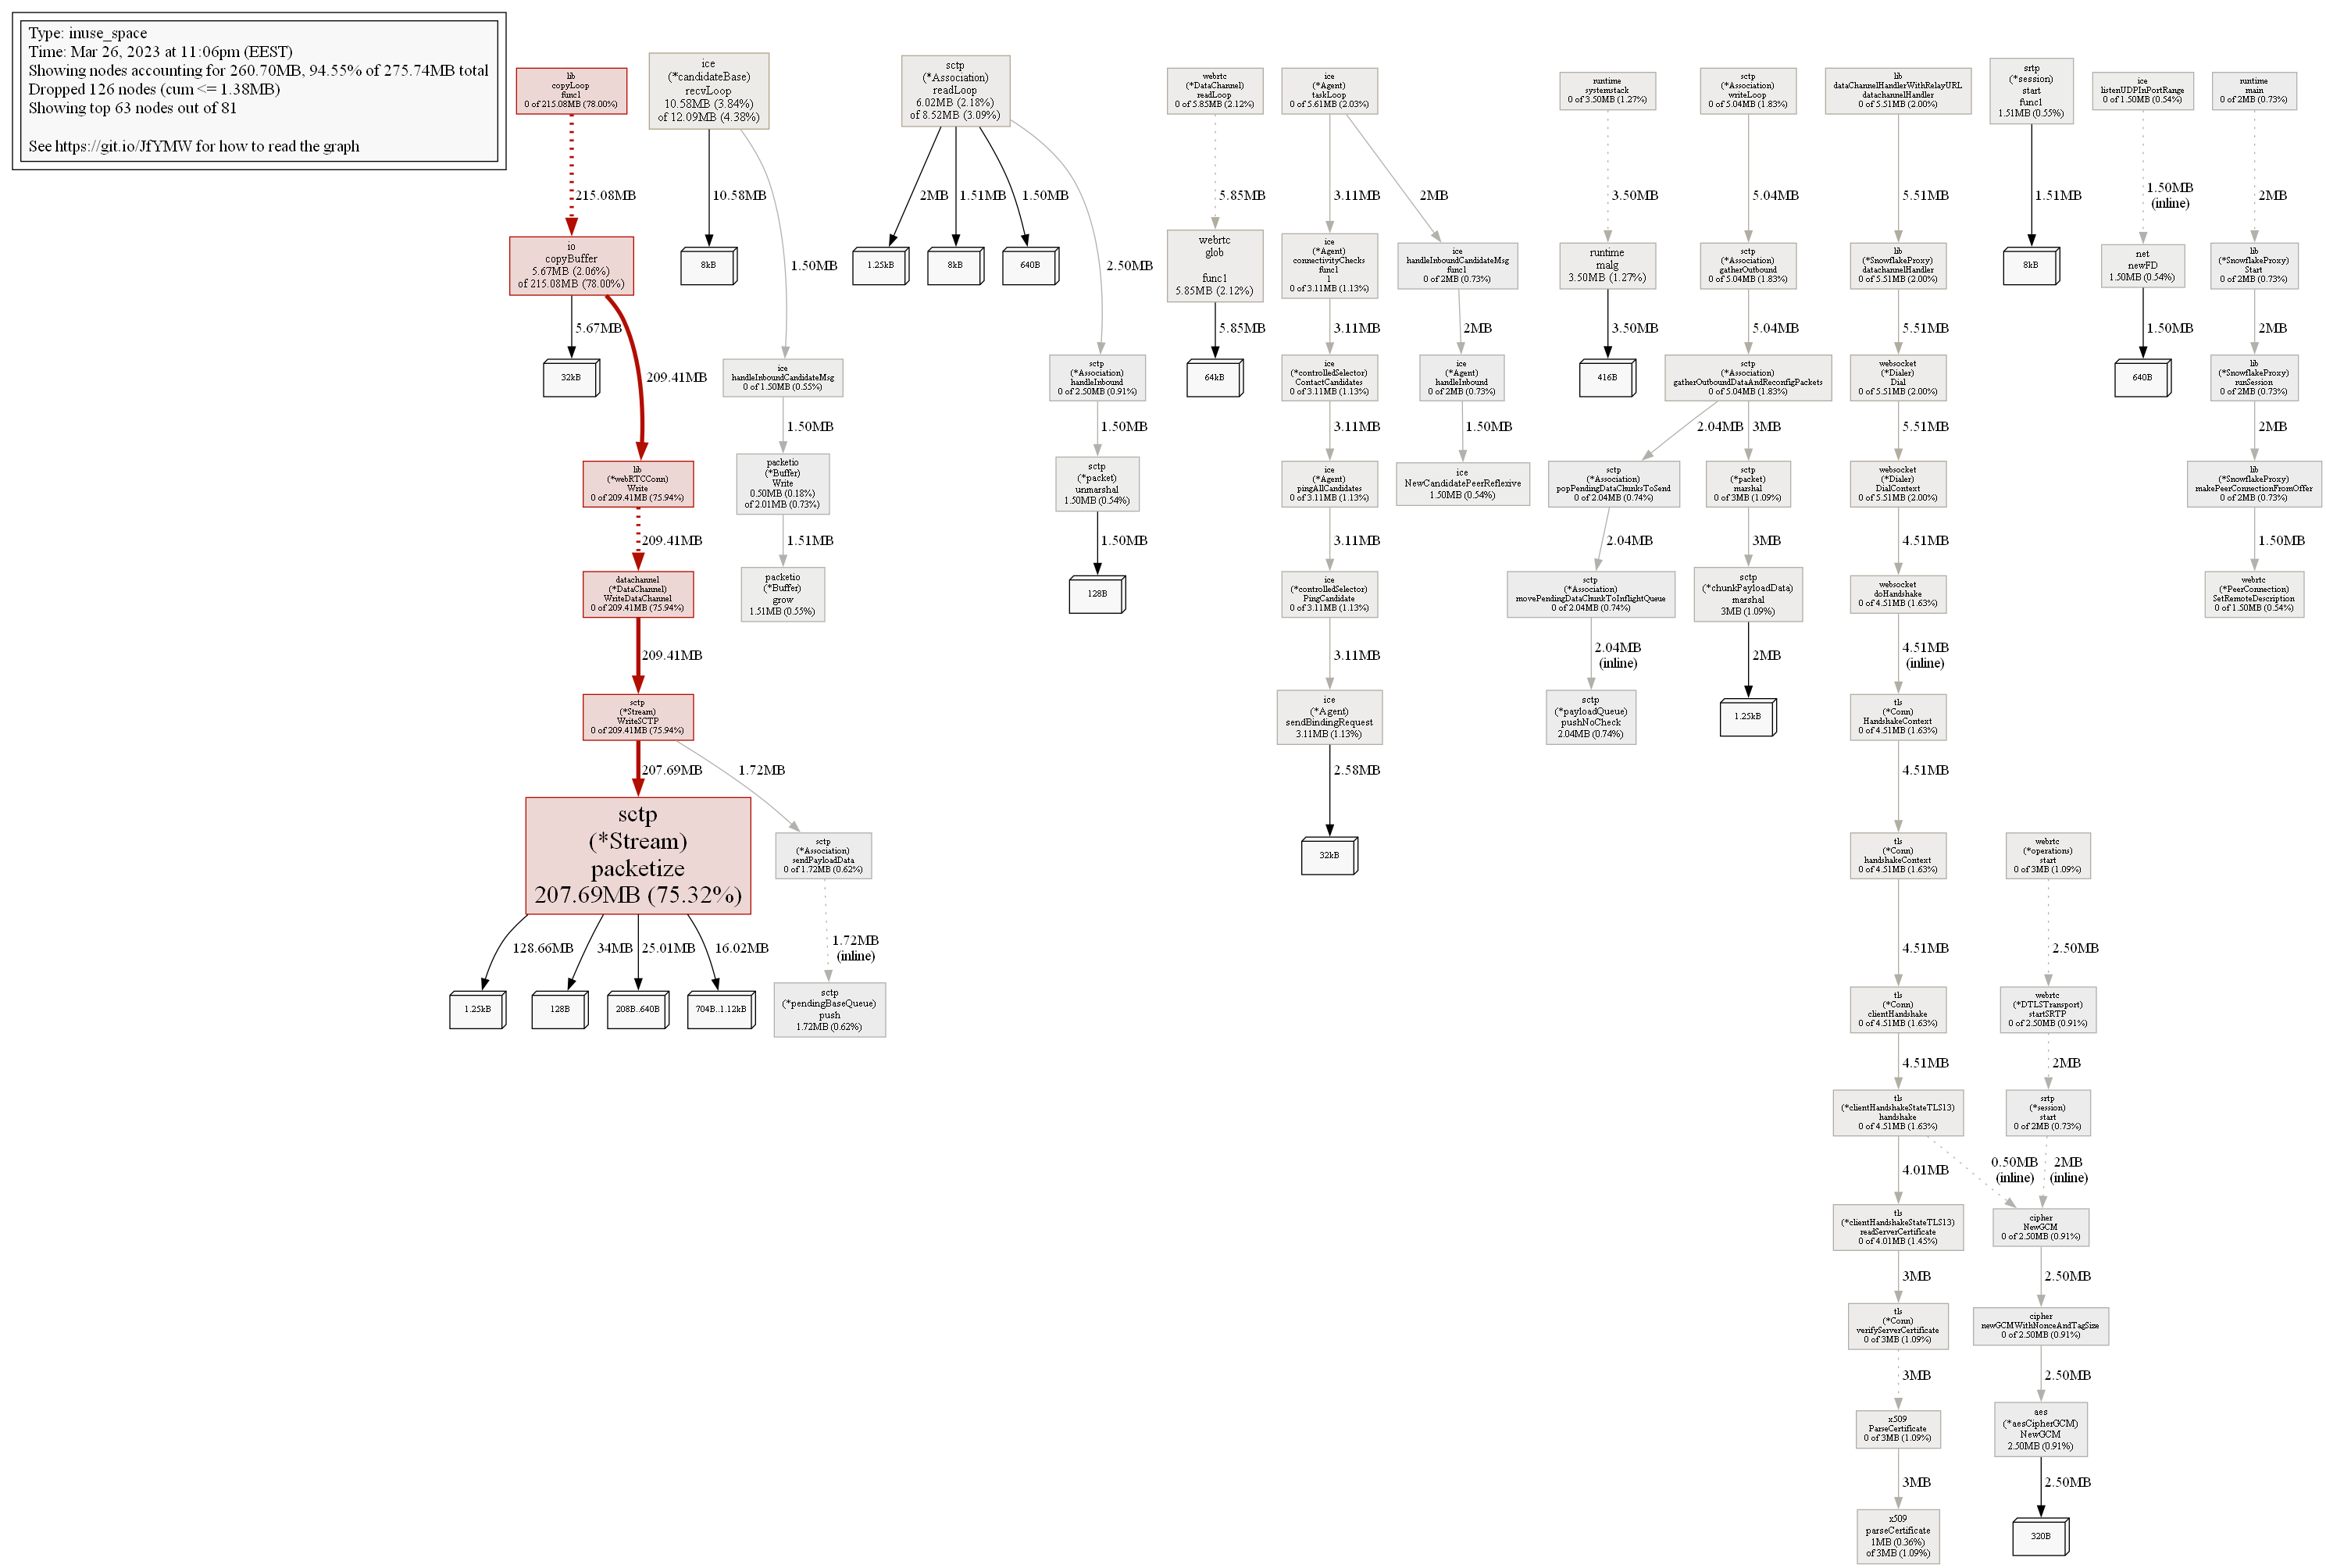
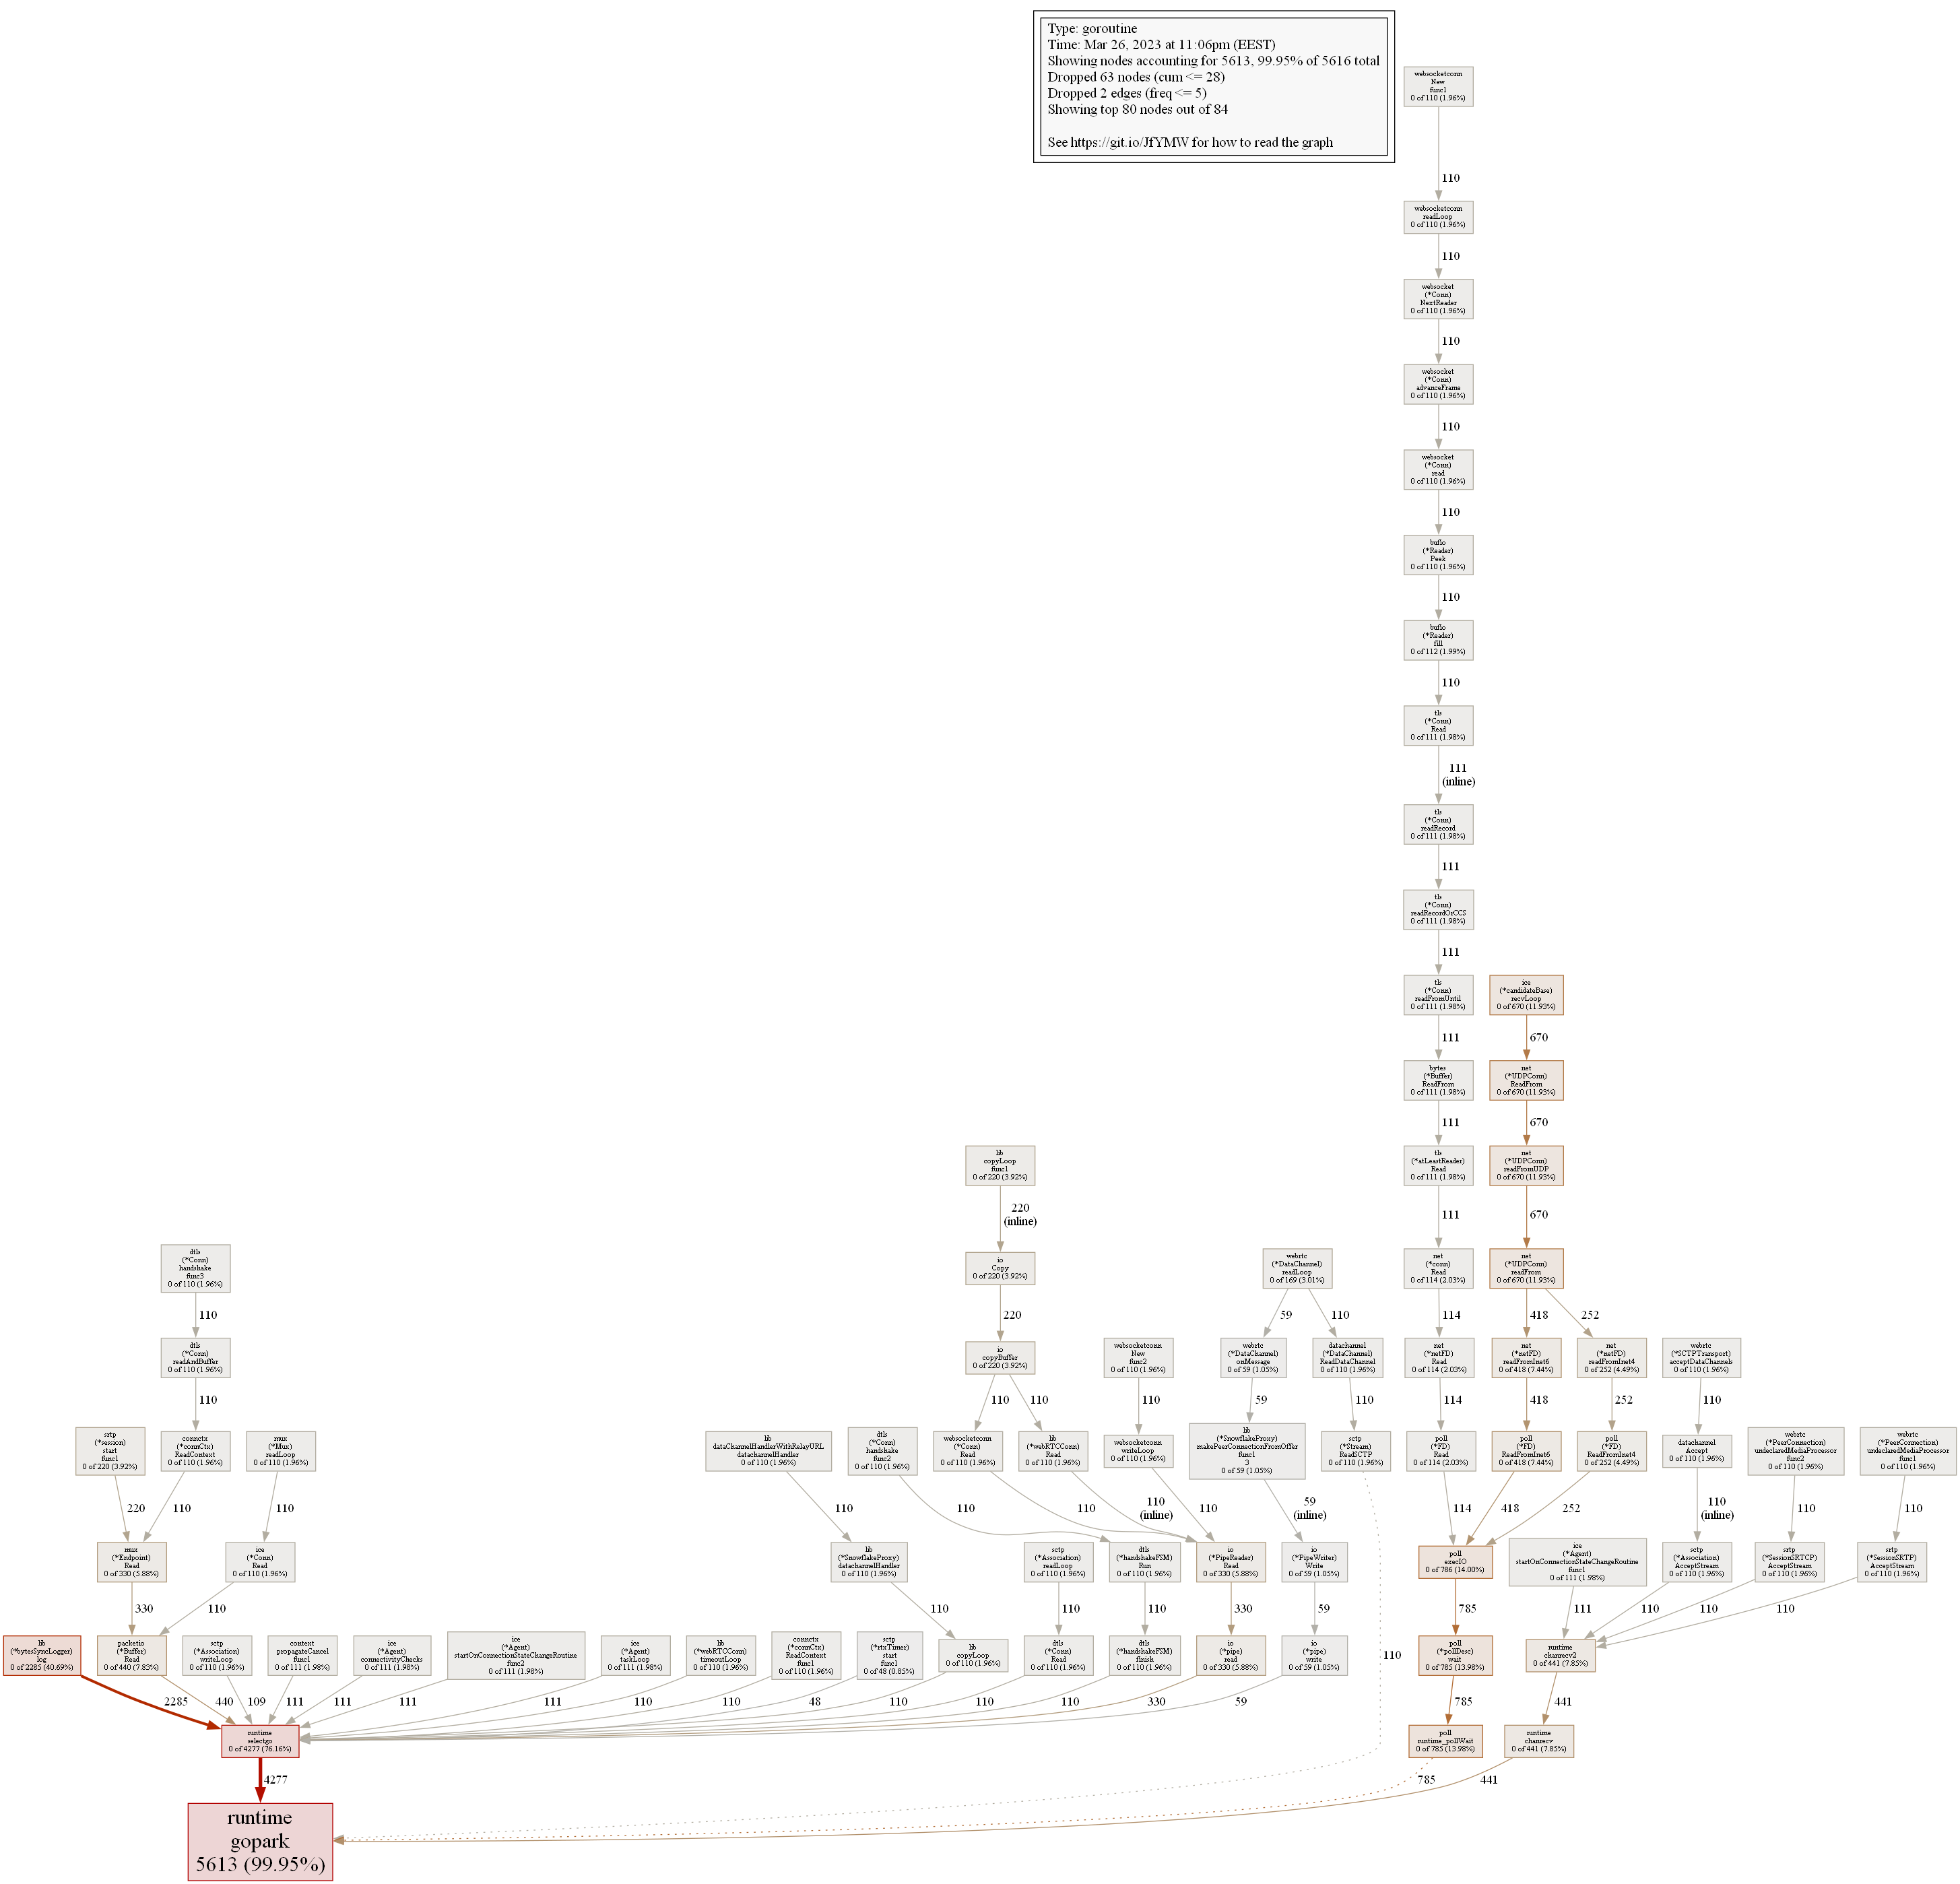
After looking further at ReadFromInet6, I can see that it is somehow proportional to the amount of users, so no problems with it.
However, proxy/lib.(*bytesSyncLogger).log is not fine, its amounts keeps growing indefinitely. I doubt that it is the main reason of problems with memory, but it is worth looking there nevertheless.
Main problems with memory, most liklely, somehow related to pion/sctp.(*Stream).packetize.
Sometimes its RAM usage shrinks, but overall it keeps growing.
What also important is that I see that proxy periodically loses lots of clients. I wonder if it is related to the latest changes in server code.
During such events RAM consumption becomes lower, but not recovers fully. For example, right now client count is 112 compared to 141 previously, but RAM consumption is higher than before nevertheless.
Logs during connection drops are filled with
io.Copy inside CopyLoop generated an error: write tcp [scrubbed]->[scrubbed]: wsasend: An existing connection was forcibly closed by the remote host.
and io.Copy inside CopyLoop generated an error: read tcp [scrubbed]->[scrubbed]: wsarecv: A connection attempt failed because the connected party did not properly respond after a period of time, or established connection failed because connected host has failed to respond.
Here is the log file in case someone wants to analyze it: log.txt (1,3 МБ)
upd2. I’ve posted some additional information I found to the corresponding bug report.
upd3. I’ve embedded suggestion found in pion docs into snowflake.
Without knowing language, results are probably quite chaotic, but at least I’ve tried!
https://gitlab.torproject.org/Vort/snowflake/-/commit/c8d51fc930ba019997cdefb28310762dd459b98a
upd4. Attempt #2:
https://gitlab.torproject.org/Vort/snowflake/-/commit/57f9b56a0af7488db43579c4848dcde7d009a8d4
upd5. Attempt #3:
4 Likes
Looks like 0f6b5f7d change helped to lower memory consumption.
Right now my proxy have uptime of 5 hours, uses 237 MiB of RAM and serves 137 clients.
Usage stats looks normal:
2023/03/28 08:33:27 In the last 1h0m0s, there were 165 connections. Traffic Relayed ↓ 1085850 KB, ↑ 162744 KB.
2023/03/28 09:33:27 In the last 1h0m0s, there were 262 connections. Traffic Relayed ↓ 3290910 KB, ↑ 566858 KB.
2023/03/28 10:33:27 In the last 1h0m0s, there were 268 connections. Traffic Relayed ↓ 3448239 KB, ↑ 592453 KB.
2023/03/28 11:33:27 In the last 1h0m0s, there were 319 connections. Traffic Relayed ↓ 4383309 KB, ↑ 719133 KB.
2023/03/28 12:33:27 In the last 1h0m0s, there were 285 connections. Traffic Relayed ↓ 3957932 KB, ↑ 603844 KB.
Client connections are not dropped and can be served for hours. Few examples:
2023/03/28 10:30:32 Traffic throughput (down|up): 272901 KB|24837 KB -- (71141 OnMessages, 226498 Sends, over 4350 seconds)
2023/03/28 11:08:01 Traffic throughput (down|up): 395737 KB|30699 KB -- (110215 OnMessages, 330594 Sends, over 10310 seconds)
2023/03/28 13:04:11 Traffic throughput (down|up): 141150 KB|17365 KB -- (50272 OnMessages, 123458 Sends, over 18799 seconds)
Do anyone want to test it?
1 Like