Anyone experiencing problems with Snowflake proxy?

P.S.
This is a 6 core 12 thread bare metal with 64 GB of RAM. I can increase or decrease the RAM for the container as needed but no matter what I set the RAM it’s maxed out within hours.

The Spikes are due to the higher than normal amount of data being processed and relayed. If this was a Tor relay I would say it’s under a DDoS attack but I’m not an expert in the ins and outs of snowflake proxy to make an accurate guess here.

I don’t see this issue at my docker setup.

2 snowflake instances - each ~between 100-200users and RAM is at 3.5 GB usage.
Also traffic looks a bit below 1GB/hour/instance.

2023/03/17 12:34:22 In the last 1h0m0s, there were 164 connections. Traffic Relayed ↑ 701163 KB, ↓ 304479 KB.
2023/03/17 13:34:22 In the last 1h0m0s, there were 156 connections. Traffic Relayed ↑ 730531 KB, ↓ 178194 KB.
2023/03/17 14:34:22 In the last 1h0m0s, there were 132 connections. Traffic Relayed ↑ 538262 KB, ↓ 111091 KB.
2023/03/17 15:34:22 In the last 1h0m0s, there were 150 connections. Traffic Relayed ↑ 664891 KB, ↓ 191459 KB.
2023/03/17 16:34:22 In the last 1h0m0s, there were 204 connections. Traffic Relayed ↑ 811295 KB, ↓ 232819 KB.
2023/03/17 17:34:22 In the last 1h0m0s, there were 120 connections. Traffic Relayed ↑ 239254 KB, ↓ 146834 KB.
2023/03/17 18:34:22 In the last 1h0m0s, there were 116 connections. Traffic Relayed ↑ 231836 KB, ↓ 245149 KB.

My guess that after this fix, connections started to live longer.
In combination with memory leak, which correlates with user/connection count, this results in increase of RAM consumption.

Yes, I’m noticing the same data spikes and corresponding impact on RAM usage.

1 Like

I had to bail on Docker, because depite the ability to dial back RAM for the container it was still a brutal performance hit on the laptop I was using at the time. Even without docker there is still a noticable impact, even on more powerful machines.

I know that’s kinda beside the point here since the issue isn’t just at the operator level. So thanks for opening this issue as it’s good feedback for the snowflake developers who’ve been trying to deal with the effect of the massive increase in usage. Would you consider opening an issue on the snowflake repo?

3 Likes

It most likely is snowflake!140 / snowflake#40262. That fix / deployment uncorked a big performance increase that enabled more use of bandwidth. See the snowflake-01 graph at Deploy snowflake-server for QueuePacketConn buffer reuse fix (#40260) (#40262) · Issues · The Tor Project / Anti-censorship / Pluggable Transports / Snowflake · GitLab

The reduced number of connections is probably because the bug that was fixed could cause spurious disconnection errors; see here.

1 Like

Thank you for the response.

Yes, thank you for the links. I’d read them. Just to clarify your conclusion, are you saying that in the past we were falsely reporting twice as many snowflake users because they would get disconnected and come back over and over again, and the current numbers are the accurate ones?

Also, based on your conclusion, would I be correct to assume that the reason we have a spike in bandwidth usage is because in the past, people were getting cut off and couldn’t use snowflake as freely and now that they have a stable connection, they are using 5-6 times the bandwidth? In other words, this is not a bug, it’s a feature.

Do we have any reports from users, indicating a huge performance spike when using snowflake?

Currently I don’t have a bandwidth limitation as they are running on two bare metal servers, at two different providers. But if I did have a bandwidth limit, like majority of people, at this rate I’d have to shut down 20-25 of my proxies and only run 5-10 to use the same bandwidth as before. Not to mention the increase in RAM usage.

I personally don’t have a problem with that if this is indeed a feature and benefits the users, but are we sure?

Thank you for your time.

No, estimating the number of users doesn’t work by counting connections, it works by counting directory requests, which Tor clients do every few hours. The number of distinct connections does not affect how often a Tor client does a directory request, so the estimated number of users doesn’t change. See:

In the snowflake-01 relay search graphs, you can see that the increase in bandwidth since 2023-03-13 has not been matched by an increase in users, at least not yet. It looks like the same number of users is getting better bandwidth.

Yes, I think that’s right. I don’t know why it wasn’t detected as a larger problem before now. Because of the nature of the bug, it may be that it wasn’t a bigger problem when there were fewer overall users.

I don’t think it’s a 5–6× increase in bandwidth for all users or all proxies. More like 2× on average. Your proxies might be disproportionately affected if they have good connectivity.

I am not aware of any, but I can testify to it myself.

That’s fine. Shut down however many proxies you need to stay within your resource limits. I have little doubt that the snowflake#40262 deployment is the cause of traffic changes you are seeing. I restarted the process myself and watched the bandwidth use immediately increase as a result.

Thanks for running Snowflake proxies.

1 Like

Yes. I can also testify to it. Here’s one example:

2023/03/18 01:56:45 In the last 1h0m0s, there were 8 connections. Traffic Relayed ↑ 1182862 KB, ↓ 179716 KB.

That’s the middle of the night in Iran.

I’m also seeing hours with ~200 connections producing 8 GB + of traffic where prior to the snowflake#40262 deployment it would have been about 2 GB.

1 Like

Thanks for clarifying things. I have no doubt the tweak is responsible for the lower connection numbers and the accuracy of them but to be honest with you I don’t believe the tweak is responsible for the huge spike I’m experiencing in traffic.

Any effect that any tweak might have would generally be proportionate. In this case, you’d see higher proportionate bandwidth across the board as you observed. It shouldn’t increase the traffic 8 fold on some containers and have little effect on others.

As much as I like to avoid the use of the word “attack”, everything about this smells like it.

How likely is it for someone to use a snowflake proxy as an entry point to attack a third party or the Tor network? Could someone point at snowflake proxy and flood it with data destined for a web site or any guard relay? Wouldn’t the proxy do its best to relay as much of it as it can to the point of crashing?

Some of my containers are maxing out 8 GB of RAM in 5 hours and run out of memory, crash and restart.

1 Like

I hate to flood the forum with log files but I’m going to post a fraction of what I get in the log to show what’s happening.

runtime stack:
runtime.throw({0x927582?, 0x400000?})
        /usr/local/go/src/runtime/panic.go:992 +0x71
runtime.sysMap(0xc046000000, 0x40b969?, 0xc00003e548?)
        /usr/local/go/src/runtime/mem_linux.go:189 +0x11b
runtime.(*mheap).grow(0xcc7a00, 0xc00003e400?)
        /usr/local/go/src/runtime/mheap.go:1413 +0x225
runtime.(*mheap).allocSpan(0xcc7a00, 0x1, 0x0, 0x11)
        /usr/local/go/src/runtime/mheap.go:1178 +0x171
runtime.(*mheap).alloc.func1()
        /usr/local/go/src/runtime/mheap.go:920 +0x65
runtime.systemstack()
        /usr/local/go/src/runtime/asm_amd64.s:469 +0x49

goroutine 194426 [running]:
runtime.systemstack_switch()
        /usr/local/go/src/runtime/asm_amd64.s:436 fp=0xc001d7bbd0 sp=0xc001d7bbc8 pc=0x460d60
runtime.(*mheap).alloc(0x0?, 0xc001d7bd30?, 0x80?)
        /usr/local/go/src/runtime/mheap.go:914 +0x65 fp=0xc001d7bc18 sp=0xc001d7bbd0 pc=0x426705
runtime.(*mcentral).grow(0x2000?)
        /usr/local/go/src/runtime/mcentral.go:244 +0x5b fp=0xc001d7bc60 sp=0xc001d7bc18 pc=0x41751b
runtime.(*mcentral).cacheSpan(0xcd8900)
        /usr/local/go/src/runtime/mcentral.go:164 +0x30f fp=0xc001d7bcb8 sp=0xc001d7bc60 pc=0x41734f
runtime.(*mcache).refill(0x7f2baac835b8, 0x11)
        /usr/local/go/src/runtime/mcache.go:162 +0xaf fp=0xc001d7bcf0 sp=0xc001d7bcb8 pc=0x4169cf
runtime.(*mcache).nextFree(0x7f2baac835b8, 0x11)
        /usr/local/go/src/runtime/malloc.go:886 +0x85 fp=0xc001d7bd38 sp=0xc001d7bcf0 pc=0x40ca65
runtime.mallocgc(0x60, 0x0, 0x1)
        /usr/local/go/src/runtime/malloc.go:1085 +0x4e5 fp=0xc001d7bdb0 sp=0xc001d7bd38 pc=0x40d0e5
runtime.makechan(0x0?, 0x0)
        /usr/local/go/src/runtime/chan.go:96 +0x11d fp=0xc001d7bdf0 sp=0xc001d7bdb0 pc=0x40563d
github.com/pion/sctp.(*ackTimer).start(0xc00143ca80)
        /go/pkg/mod/github.com/pion/sctp@v1.8.2/ack_timer.go:51 +0x9f fp=0xc001d7be40 sp=0xc001d7bdf0 pc=0x6c785f
github.com/pion/sctp.(*Association).handleChunkEnd(0xc000b16a80)
        /go/pkg/mod/github.com/pion/sctp@v1.8.2/association.go:2238 +0x9e fp=0xc001d7be80 sp=0xc001d7be40 pc=0x6d673e
github.com/pion/sctp.(*Association).handleInbound(0xc000b16a80, {0xc03c7f3700?, 0x2000?, 0xc001b7ff70?})
        /go/pkg/mod/github.com/pion/sctp@v1.8.2/association.go:608 +0x2ea fp=0xc001d7bf28 sp=0xc001d7be80 pc=0x6cb54a
github.com/pion/sctp.(*Association).readLoop(0xc000b16a80)
        /go/pkg/mod/github.com/pion/sctp@v1.8.2/association.go:521 +0x1cd fp=0xc001d7bfc8 sp=0xc001d7bf28 pc=0x6ca1ed
github.com/pion/sctp.(*Association).init.func2()
        /go/pkg/mod/github.com/pion/sctp@v1.8.2/association.go:339 +0x26 fp=0xc001d7bfe0 sp=0xc001d7bfc8 pc=0x6c9006
runtime.goexit()
        /usr/local/go/src/runtime/asm_amd64.s:1571 +0x1 fp=0xc001d7bfe8 sp=0xc001d7bfe0 pc=0x462e41
created by github.com/pion/sctp.(*Association).init
        /go/pkg/mod/github.com/pion/sctp@v1.8.2/association.go:339 +0xd0

goroutine 107 [IO wait]:
internal/poll.runtime_pollWait(0x7f2b84015f68, 0x72)
        /usr/local/go/src/runtime/netpoll.go:302 +0x89
internal/poll.(*pollDesc).wait(0xc0001da480?, 0xc00024c000?, 0x0)
        /usr/local/go/src/internal/poll/fd_poll_runtime.go:83 +0x32
internal/poll.(*pollDesc).waitRead(...)
        /usr/local/go/src/internal/poll/fd_poll_runtime.go:88
internal/poll.(*FD).Read(0xc0001da480, {0xc00024c000, 0x13d6, 0x13d6})
        /usr/local/go/src/internal/poll/fd_unix.go:167 +0x25a
net.(*netFD).Read(0xc0001da480, {0xc00024c000?, 0xc00028b820?, 0xc00024c02a?})
        /usr/local/go/src/net/fd_posix.go:55 +0x29
net.(*conn).Read(0xc000112108, {0xc00024c000?, 0x1ffffffffffffff?, 0x39?})
        /usr/local/go/src/net/net.go:183 +0x45
crypto/tls.(*atLeastReader).Read(0xc04416ca08, {0xc00024c000?, 0x0?, 0x8?})
        /usr/local/go/src/crypto/tls/conn.go:785 +0x3d
bytes.(*Buffer).ReadFrom(0xc000155078, {0x9daf60, 0xc04416ca08})
        /usr/local/go/src/bytes/buffer.go:204 +0x98
crypto/tls.(*Conn).readFromUntil(0xc000154e00, {0x9db920?, 0xc000112108}, 0x13b1?)
        /usr/local/go/src/crypto/tls/conn.go:807 +0xe5
crypto/tls.(*Conn).readRecordOrCCS(0xc000154e00, 0x0)
        /usr/local/go/src/crypto/tls/conn.go:614 +0x116
crypto/tls.(*Conn).readRecord(...)
        /usr/local/go/src/crypto/tls/conn.go:582
crypto/tls.(*Conn).Read(0xc000154e00, {0xc0002c2000, 0x1000, 0x7f0360?})
        /usr/local/go/src/crypto/tls/conn.go:1285 +0x16f
bufio.(*Reader).Read(0xc0001b3c80, {0xc0001244a0, 0x9, 0x7fe722?})
        /usr/local/go/src/bufio/bufio.go:236 +0x1b4
io.ReadAtLeast({0x9dae00, 0xc0001b3c80}, {0xc0001244a0, 0x9, 0x9}, 0x9)
        /usr/local/go/src/io/io.go:331 +0x9a
io.ReadFull(...)
        /usr/local/go/src/io/io.go:350
net/http.http2readFrameHeader({0xc0001244a0?, 0x9?, 0xc0442860f0?}, {0x9dae00?, 0xc0001b3c80?})
        /usr/local/go/src/net/http/h2_bundle.go:1566 +0x6e
net/http.(*http2Framer).ReadFrame(0xc000124460)
        /usr/local/go/src/net/http/h2_bundle.go:1830 +0x95
net/http.(*http2clientConnReadLoop).run(0xc00004bf98)
        /usr/local/go/src/net/http/h2_bundle.go:8819 +0x130
net/http.(*http2ClientConn).readLoop(0xc00024a300)
        /usr/local/go/src/net/http/h2_bundle.go:8715 +0x6f
created by net/http.(*http2Transport).newClientConn
        /usr/local/go/src/net/http/h2_bundle.go:7443 +0xa65
~~~
This goes on for pages and pages in the log.

I hope I can reassure you. Clients cannot cause a proxy to attack or even connect to an arbitrary web site or relay. There is no way for a client to directly control what endpoint the proxy connects to; the client can only give the broker a bridge fingerprint and then the broker maps the bridge fingerprint to a domain name using a local JSON database. The broker doesn’t permit arbitrary bridge fingerprints, only the ones it knows about (currently 2 of them). On top of that, proxies will not connect to just any domain name the broker gives them; proxies themselves enforce the rule that they will only connect to subdomains of snowflake.torproject.net (e.g. 01.snowflake.torproject.net, 02.snowflake.torproject.net). So even a compromise of the broker could not cause proxies to attack arbitrary targets.

I don’t see the logic behind your claim that an increase in bandwidth must be proportional across all proxies. Some proxies may have been on lower-speed residential connections, and been at their bandwidth maximum even before the fix on 2023-03-13 that let clients use more bandwidth. Those proxies that were maxed out will not have seen any increase in total bandwidth. Your proxies, on the other hand, have unusually good connectivity, which means that they have room to grow when clients start to use more bandwidth. Evidently the total increase in bandwidth use was about 2× on average; some proxies saw less than that, some more.

I’m sorry your proxies are crashing. That’s clearly a bug and should not happen, but there’s a clear reason why it should have begun happening a few days ago. I suggest that you try using the -capacity command-line option to limit the number of clients served concurrently. Start with -capacity 10, see how it goes, and increase from there if resources permit.

1 Like

Sounds good. Thank you for the time you’ve taken to explain and clarify things for me. It’s very much appreciated.

Yes, It all depends on how your provider implements their network. It’s one of the main reasons people in Iran have a much harder time accessing some servers as opposed to others and why you hear some say snowflake or V2ray proxies work in Iran and some say they don’t work. But that’s a subject for another post.

To be honest, the main reason I started serving snowflake proxies was when I heard about what’s going on in Iran, and if the proxy can help 200 people as opposed to 10, I’ll take 200. I just have to figure out a way to make it work and hopefully figure out what the bug is. The resources are not an issue. The problem is that the proxy maxes out whatever amount of RAM you give it within hours whether it’s 2GB of RAM or 10.

Again I thank you for the time you’ve taken.

To do this you need either to know how Snowflake in particular and programming in general works, or to have social skills to convince developers to look into this problem.

If you have unlimited amount of RAM, then what’s the problem?

Another method of helping with bug hunting is collection of data.
You can collect data about RAM usage over time, test what I said about correlation and share resulting information with other people in corresponding bug report.
If you don’t know what correlation means, I will try to explain it.

Looks like someone got off the wrong side of the bed. :slight_smile: I say that because you generally seem very helpful in these forums and I appreciate that.

I see that you answered your own question by quoting me answering that question. :grinning:

The subject of this post clearly explains my intentions. I’m asking if others are experiencing this problem. If there are enough people experiencing it, then it’s a bug . If it’s just me and a couple of other people, then it might be my particular setup, my OS or a bunch of other things and that would make it my problem to solve and not the subject of a bug report.

If this is indeed a bug, I will decide how much time I’d like to spend filing a bug report. I promise to ask you to teach me what correlation means if I decide to do so.

My guess is that your guess is right. By the way that bug report is two months old with no clear response and I doubt that has anything to do with lack of social skills on the part of the participants.

Cheers.

Thank you for your feedback :
@Enkidu-6 & @Quartermarsh
that will be useful for those who are looking to understand and do not have your expertise on this type of incident
best regards

1 Like

Increase in RAM consumption over time other people see as well.
However, consumption growth almost stops after several days of uptime.
For me “target” value is somewhere between 1 and 2 GB with 100-200 simultaneously connected users.
Growth to ~8 GB I saw only once and it did not reproduced since then.

If you show how exactly RAM consumption behaves for you, other people can compare.
If you test “maxing whatever amount” behaviour with low -capacity, it may help narrow down range of possible problems.

And it looks like developers have enough technical skills to solve such problems.
But something is still wrong with how things are going on here.
And it is better either to solve problems with solving problems or at least clarify what is wrong and why.
Tor is useful project overall, but weeks long lags in conversations makes too hard to make useful contributions, at least for me.
(However, I can’t promise to make huge contribution)

1 Like

After the recent update I can see the amount of data processed per hour varies more wildly and (now I have the theory) it may be because the connections live longer, if clients needed to reconnect more, the load would be more evenly distributed among proxies, now that you ‘hold on’ to your clients, depending on their activity which presumably various wildly per user you will see this reflected in the bandwidth stats.

1 Like

My apologies for not responding sooner. I was dealing with other projects and I had to put this on the back burner.

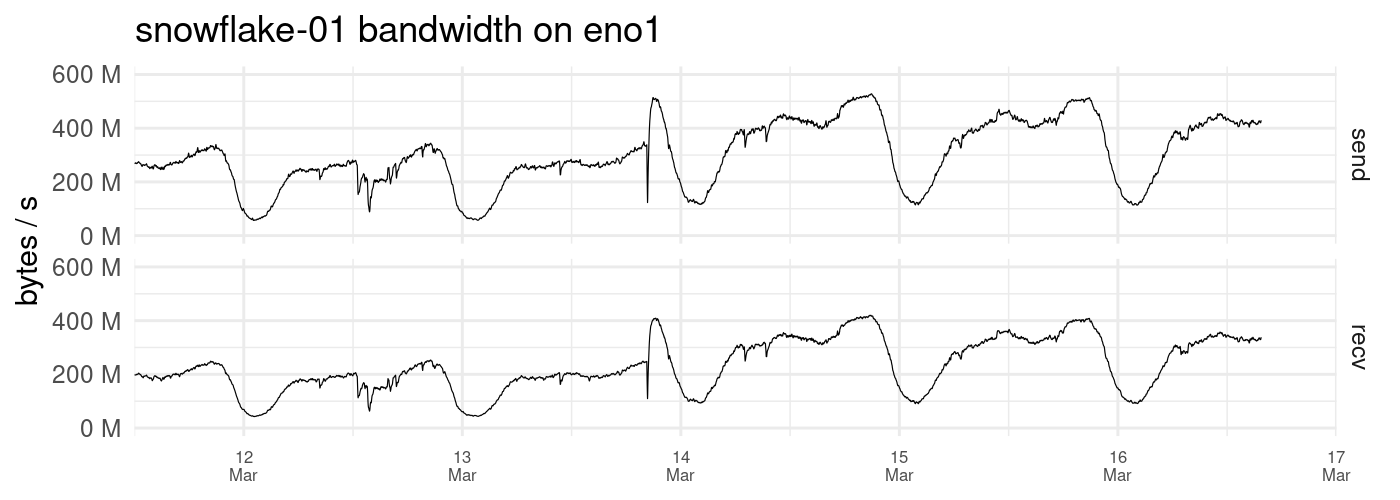
To give you an update and also to give you a more accurate picture of my setup, I’m running my snowflakes on a bare metal and under several VMs. Each virtual machine has its own IP address and operating system and runs 5 docker containers / snowflake proxies. I must also admit that my network does have unusually good connectivity and attracts a lot of Iranian users who may not be able to connect to other setups as you will see in my logs later in this post. Currently each 5 container setup relays just about as much traffic as a Tor relay with Max Advertised bandwidth of 15 MiB which is cool.

I’m sure the memory leak is there which means the memory usage goes up when the activities are high, which is understandable, but the memory doesn’t fully recover when things cool down. This leads to the eventual OOM crash.

The good part is that the whole VM doesn’t crash. Only the containers and they do so one at a time, couple of hours apart so the rest of them keep on relaying. and the ones that crash, restart by themselves immediately and keep going. This is only noticeable if you’re monitoring the memory as it partially drops when one of the containers restart. You can also notice this in the log which only indicates the restart with no other clue. Aside from that, there are no error messages in the docker logs. You can only see an indication of oom kill and disconnected shim in the system logs :

Mar 21 10:29:59 vpn kernel: oom-kill:constraint=CONSTRAINT_NONE,nodemask=(null),cpuset=f5dec5eb8a4034e22bbc3a5eb2b038e918f645d786d9de614375e13635bf7fe5,mems_allowed=0,global_oom,task_memcg=/docker/039c643a0198f2d378c3515538d053a38873408b526cc3134923b9b07f8ef971,task=proxy,pid=8477,uid=1000
Mar 21 10:29:59 vpn kernel: Out of memory: Killed process 8477 (proxy) total-vm:2375972kB, anon-rss:904156kB, file-rss:1720kB, shmem-rss:0kB, UID:1000 pgtables:3448kB oom_score_adj:0
Mar 21 10:29:59 vpn containerd[853]: time="2023-03-21T10:29:59.599814434Z" level=info msg="shim disconnected" id=039c643a0198f2d378c3515538d053a38873408b526cc3134923b9b07f8ef971
Mar 21 10:29:59 vpn containerd[853]: time="2023-03-21T10:29:59.603234663Z" level=warning msg="cleaning up after shim disconnected" id=039c643a0198f2d378c3515538d053a38873408b526cc3134923b9b07f8ef971 namespace=moby
Mar 21 10:29:59 vpn containerd[853]: time="2023-03-21T10:29:59.603479972Z" level=info msg="cleaning up dead shim"
Mar 21 10:29:59 vpn dockerd[1185]: time="2023-03-21T10:29:59.602807645Z" level=info msg="ignoring event" container=039c643a0198f2d378c3515538d053a38873408b526cc3134923b9b07f8ef971 module=libcontainerd namespace=moby topic=/tasks/delete type="*events.TaskDelete"
Mar 21 10:29:59 vpn containerd[853]: time="2023-03-21T10:29:59.626274657Z" level=warning msg="cleanup warnings time=\"2023-03-21T10:29:59Z\" level=info msg=\"starting signal loop\" namespace=moby pid=9028 runtime=io.containerd.runc.v2\n"
Mar 21 10:29:59 vpn systemd[1]: var-lib-docker-overlay2-8a4cc8ea209ea49b8d28e7d573968499aa122988853a6ea0eca9450758c7bb2a-merged.mount: Succeeded.
Mar 21 10:29:59 vpn containerd[853]: time="2023-03-21T10:29:59.919039358Z" level=info msg="loading plugin \"io.containerd.event.v1.publisher\"..." runtime=io.containerd.runc.v2 type=io.containerd.event.v1
Mar 21 10:29:59 vpn containerd[853]: time="2023-03-21T10:29:59.919108918Z" level=info msg="loading plugin \"io.containerd.internal.v1.shutdown\"..." runtime=io.containerd.runc.v2 type=io.containerd.internal.v1
Mar 21 10:29:59 vpn containerd[853]: time="2023-03-21T10:29:59.919125321Z" level=info msg="loading plugin \"io.containerd.ttrpc.v1.task\"..." runtime=io.containerd.runc.v2 type=io.containerd.ttrpc.v1
Mar 21 10:29:59 vpn containerd[853]: time="2023-03-21T10:29:59.919381751Z" level=info msg="starting signal loop" namespace=moby path=/run/containerd/io.containerd.runtime.v2.task/moby/039c643a0198f2d378c3515538d053a38873408b526cc3134923b9b07f8ef971 pid=9048 runtime=io.containerd.runc.v2

And to get a better picture of the kind of connections, this is the log for one of the containers out of 5 on one of the VMs:

2023/03/23 05:29:32 Proxy starting
2023/03/23 05:29:39 NAT type: unrestricted
2023/03/23 06:29:32 In the last 1h0m0s, there were 151 connections. Traffic Relayed ↑ 1672090 KB, ↓ 201928 KB.
2023/03/23 07:29:32 In the last 1h0m0s, there were 184 connections. Traffic Relayed ↑ 3237160 KB, ↓ 397758 KB.
2023/03/23 08:29:32 In the last 1h0m0s, there were 220 connections. Traffic Relayed ↑ 4426205 KB, ↓ 577664 KB.
2023/03/23 09:29:32 In the last 1h0m0s, there were 240 connections. Traffic Relayed ↑ 6414385 KB, ↓ 925416 KB.
2023/03/23 10:29:32 In the last 1h0m0s, there were 245 connections. Traffic Relayed ↑ 5536270 KB, ↓ 832924 KB.
2023/03/23 11:29:32 In the last 1h0m0s, there were 256 connections. Traffic Relayed ↑ 3594474 KB, ↓ 618120 KB.
2023/03/23 12:29:32 In the last 1h0m0s, there were 239 connections. Traffic Relayed ↑ 4400832 KB, ↓ 631875 KB.
2023/03/23 13:29:32 In the last 1h0m0s, there were 255 connections. Traffic Relayed ↑ 6612566 KB, ↓ 792439 KB.
2023/03/23 14:29:32 In the last 1h0m0s, there were 259 connections. Traffic Relayed ↑ 6693017 KB, ↓ 767227 KB.
2023/03/23 15:29:32 In the last 1h0m0s, there were 288 connections. Traffic Relayed ↑ 9075662 KB, ↓ 1082406 KB.
2023/03/23 16:29:32 In the last 1h0m0s, there were 305 connections. Traffic Relayed ↑ 11216653 KB, ↓ 1283160 KB.

The last line shows over 11 GB of data transfer in one hour. And this is a snapshot of the current unique IP addresses with ASSURED UDP status in my conntrack table and where they’re coming from:

      1 Chile
      2 China
      1 Ecuador
      1 Finland
      2 France
      4 Germany
    576 Iran
      1 Italy
      1 Japan
      1 Lithuania
      1 Netherlands
      6 Russia
      1 Ukraine
      3 United States

It was also suggested that I should reduce the number of connections to see how that works. Here’s an example of another container:

2023/03/23 10:16:09 Proxy starting
2023/03/23 10:16:21 NAT type: unrestricted
2023/03/23 11:16:09 In the last 1h0m0s, there were 32 connections. Traffic Relayed ↑ 266465 KB, ↓ 45634 KB.
2023/03/23 12:16:09 In the last 1h0m0s, there were 34 connections. Traffic Relayed ↑ 890410 KB, ↓ 92998 KB.
2023/03/23 13:16:09 In the last 1h0m0s, there were 55 connections. Traffic Relayed ↑ 701485 KB, ↓ 80086 KB.
2023/03/23 14:16:09 In the last 1h0m0s, there were 67 connections. Traffic Relayed ↑ 1369366 KB, ↓ 186713 KB.
2023/03/23 15:16:09 In the last 1h0m0s, there were 50 connections. Traffic Relayed ↑ 1402332 KB, ↓ 175346 KB.
2023/03/23 16:16:09 In the last 1h0m0s, there were 48 connections. Traffic Relayed ↑ 455562 KB, ↓ 74556 KB.
2023/03/23 17:16:09 In the last 1h0m0s, there were 56 connections. Traffic Relayed ↑ 1100026 KB, ↓ 163992 KB.

And the conntrack:

      1 Canada
      1 China
      2 Finland
      2 Germany
     30 Iran
      1 Mexico
      6 Russia
      1 Ukraine
      6 United States

I’m afraid the problem is still there. The crashes may happen less frequently but they do happen
nevertheless.

Cheers.

I have similar connection counts and traffic with my 100Mbit/s connection, overloaded by lots of services:

2023/03/23 06:39:23 In the last 1h0m0s, there were 98 connections. Traffic Relayed ↓ 2439491 KB, ↑ 351650 KB.
2023/03/23 07:39:23 In the last 1h0m0s, there were 196 connections. Traffic Relayed ↓ 3698258 KB, ↑ 554888 KB.
2023/03/23 08:39:23 In the last 1h0m0s, there were 306 connections. Traffic Relayed ↓ 9011406 KB, ↑ 1081349 KB.
2023/03/23 09:39:23 In the last 1h0m0s, there were 236 connections. Traffic Relayed ↓ 4165945 KB, ↑ 500628 KB.
2023/03/23 10:39:23 In the last 1h0m0s, there were 378 connections. Traffic Relayed ↓ 6172382 KB, ↑ 859606 KB.
2023/03/23 11:39:23 In the last 1h0m0s, there were 192 connections. Traffic Relayed ↓ 1473890 KB, ↑ 310851 KB.
2023/03/23 12:39:23 In the last 1h0m0s, there were 225 connections. Traffic Relayed ↓ 3324096 KB, ↑ 498555 KB.
2023/03/23 13:39:23 In the last 1h0m0s, there were 276 connections. Traffic Relayed ↓ 4554454 KB, ↑ 608007 KB.
2023/03/23 14:39:23 In the last 1h0m0s, there were 261 connections. Traffic Relayed ↓ 4818077 KB, ↑ 576863 KB.
2023/03/23 15:39:23 In the last 1h0m0s, there were 321 connections. Traffic Relayed ↓ 5002267 KB, ↑ 694855 KB.
2023/03/23 16:39:23 In the last 1h0m0s, there were 273 connections. Traffic Relayed ↓ 6212287 KB, ↑ 926834 KB.
2023/03/23 17:39:23 In the last 1h0m0s, there were 299 connections. Traffic Relayed ↓ 4974425 KB, ↑ 664037 KB.
2023/03/23 18:39:23 In the last 1h0m0s, there were 314 connections. Traffic Relayed ↓ 4986995 KB, ↑ 794483 KB.
2023/03/23 19:39:23 In the last 1h0m0s, there were 401 connections. Traffic Relayed ↓ 9977746 KB, ↑ 1488440 KB.
2023/03/23 20:39:23 In the last 1h0m0s, there were 224 connections. Traffic Relayed ↓ 1397196 KB, ↑ 310304 KB.
2023/03/23 21:39:23 In the last 1h0m0s, there were 284 connections. Traffic Relayed ↓ 3008116 KB, ↑ 550419 KB.

And I confirm that leak can make process grow up to 2 gigs, looks like the same amount is allowed for your container: total-vm:2375972kB.

However, it is most importantly to figure out how memory consumption behaves over the time.
If chart with used memory over time looks like oblique line, then it’s a most obvious sign of memory leak.
If chart look like logarithmic function, then there are two possibilities - it is either leak, as with previous shape, or normal operation of memory-hungry application. With just high consumption of RAM, what should be done is optimization, when in cases of leaks it needs bug fixing.